- Title
-
Inhibition of TBK1/IKKε Promotes Regeneration of Pancreatic β-cells
- Authors
- Xu, J., Jia, Y.F., Tapadar, S., Weaver, J.D., Raji, I.O., Pithadia, D.J., Javeed, N., García, A.J., Choi, D.S., Matveyenko, A.V., Oyelere, A.K., Shin, C.H.
- Source
- Full text @ Sci. Rep.
|
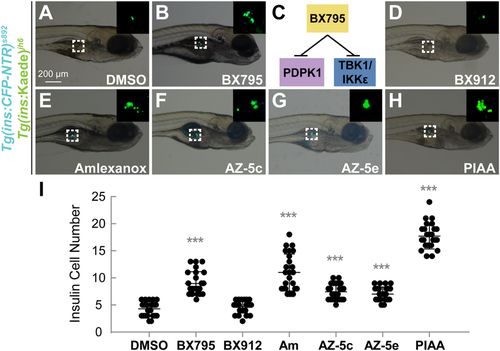
TBK1/IKKε inhibition augments β-cell regeneration in a zebrafish model of type 1 diabetes. (A, B, D–H) Bright-field images combined with fluorescent images showing the overall morphology and [Tg(ins:CFP-NTR)s892; Tg(ins:Kaede)jh6] expression (green) of larvae at 48 hpa treated with DMSO (A), BX795 (B), BX912 (D), amlexanox (E), AZ-5c (F), AZ-5e (G), and PIAA (H), respectively. While TBK1/IKKε-Is substantially expanded [Tg(ins:CFP-NTR)s892; Tg(ins:Kaede)jh6]-expressing cell population (white squares and insets) during regeneration (B and E–H) compared to DMSO (A), the PDPK1 inhibitor BX912 showed minimum effect (D). (C) BX795 is a dual inhibitor of PDPK1 and TBK1/IKKε. (I) Quantification of the number (mean ± SD) of total regenerated β-cells at 48 hpa (in A-B and D-H; 4.3 ± 1.3 (DMSO), 9.0 ± 2.2 (BX795), 4.7 ± 1.2 (BX912), 11.0 ± 3.4 (amlexanox), 7.4 ± 1.4 (AZ-5c), 7.0 ± 1.3 (AZ-5e), and 17.7 ± 2.4 (PIAA)). Cells in 20 planes of confocal images from 25 individual larvae were counted per condition. ***P < 0.001. EXPRESSION / LABELING:
PHENOTYPE:
|
|
TBK1/IKKε inhibitors promote β-cell replication. (A–D) Confocal images of [Tg(ins:CFP-NTR)s892; Tg(ins:Kaede)jh6] larvae at 48 hpa, concurrently treated with EdU and DMSO (A), BX795 (B), amlexanox (C), or PIAA (D), respectively, from 0–48 hpa. The number of β-cells that incorporated EdU (white arrows) was substantially increased in TBK1/IKKε-I-treated recovering larvae (B–D) compared to DMSO-treated larvae (A). (E) Quantification of the number (mean ± SD) of total regenerated β-cells (green) and regenerated β-cells that incorporated EdU (yellow) at 48 hpa (in A-D; 5.0 ± 1.3 total regenerated β-cells, of which 0.7 ± 0.5 (DMSO), 11.0 ± 3.4, of which 4.6 ± 1.8 (BX795), 12.8 ± 4.8, of which 5.2 ± 2.8 (amlexanox), and 20.6 ± 3.1, of which 11.0 ± 1.9 (PIAA) incorporated EdU). (F) The percentage (mean ± SD) of regenerated β-cells that incorporated EdU at 48 hpa (in A-D; 13.0 ± 11.0% (DMSO), 42.0 ± 5.0% (BX795), 39.0 ± 7.0% (amlexanox), and 55.0 ± 14.0% (PIAA)). Cells in 20 planes of confocal images from 10 individual larvae were counted per condition. **P < 0.01; ***P < 0.001. PHENOTYPE:
|
|
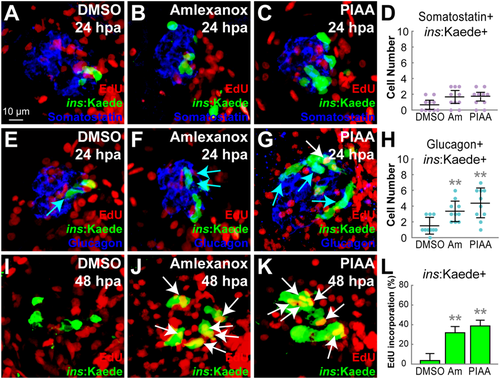
TBK1/IKKε inhibitors have modest effects on α-to-β-cell transdifferentiation but strongly enhance β-cell proliferation. (A–C) Confocal images of [Tg(ins:CFP-NTR)s892; Tg(ins:Kaede)jh6] larvae at 24 hpa, concurrently treated with EdU and DMSO (A), amlexanox (B), or PIAA (C), respectively, from 0–24 hpa, stained for Somatostatin (blue). (D) Quantification of the number (mean ± SD) of Insulin and Somatostatin-double positive cells at 24 hpa (in A-C; 0.7 ± 0.6 (DMSO), 1.7 ± 0.8 (amlexanox), and 1.8 ± 0.5 (PIAA)). (E–G) Confocal images of [Tg(ins:CFP-NTR)s892; Tg(ins:Kaede)jh6] larvae at 24 hpa, concurrently treated with EdU and DMSO (E), amlexanox (F), or PIAA (G), respectively, from 0–24 hpa, stained for Glucagon (blue). Note that the number of Insulin and Glucagon-double positive cells (blue arrows) was increased in TBK1/IKKε-I-treated recovering larvae (F, G) compared to DMSO-treated larvae (E). PIAA-treated larvae also showed an EdU-incorporated β-cell (white arrow) (G). (H) Quantification of the number (mean ± SD) of Insulin and Glucagon-double positive cells at 24 hpa (in E-G; 1.5 ± 1.1 (DMSO), 3.4 ± 1.3 (amlexanox), and 4.4 ± 1.9 (PIAA)). (I–K) Confocal images of [Tg(ins:CFP-NTR)s892; Tg(ins:Kaede)jh6] larvae at 48 hpa, concurrently treated with EdU and DMSO (I), amlexanox (J), or PIAA (K), respectively, from 24–48 hpa. The number of β-cells that incorporated EdU (white arrows) was significantly increased in TBK1/IKKε-I-treated recovering larvae (J, K) compared to DMSO-treated larvae (I). (L) The percentage (mean ± SD) of regenerated β-cells that incorporated EdU at 48 hpa (in I-K; 4.0 ± 7.0% (DMSO), 32.0 ± 6.0% (amlexanox), and 39.0 ± 6.0% (PIAA)). Cells in 20 planes of confocal images from 10 individual larvae were counted per condition. **P < 0.01. PHENOTYPE:
|
|
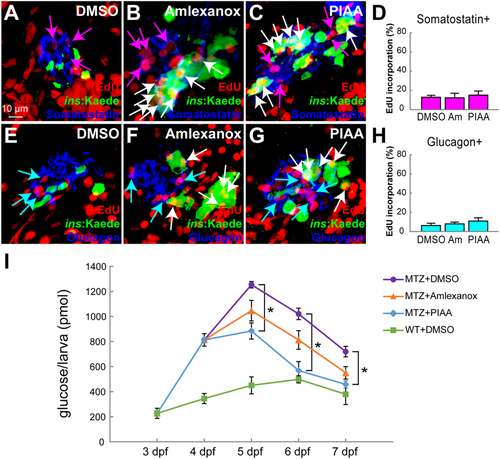
TBK1/IKKε inhibitors accelerate restoration of β-cell function by selectively increasing the number of β-cells. (A–C) Confocal images of [Tg(ins:CFP-NTR)s892; Tg(ins:Kaede)jh6] larvae at 48 hpa, concurrently treated with EdU and DMSO (A), amlexanox (B), or PIAA (C), respectively, from 0–48 hpa, stained for Somatostatin (blue). The number of Somatostatin-expressing δ-cells that incorporated EdU (purple arrows) did not increase in TBK1/IKKε-I-treated recovering larvae (B, C) compared to DMSO-treated larvae (A). (D) The percentage (mean ± SD) of δ-cells that incorporated EdU at 48 hpa (in A-C; 12.9 ± 2.0% (DMSO), 12.4 ± 4.7% (amlexanox), and 15.1 ± 4.3% (PIAA)). Cells in 20 planes of confocal images from 10 individual larvae were counted per condition. (E–G) Confocal images of [Tg(ins:CFP-NTR)s892; Tg(ins:Kaede)jh6] larvae at 48 hpa, concurrently treated with EdU and DMSO (E), amlexanox (F), or PIAA (G), respectively, from 0–48 hpa, stained for Glucagon (blue). The number of Glucagon-expressing α-cells that incorporated EdU (blue arrows) did not increase in TBK1/IKKε-I-treated recovering larvae (F, G) compared to DMSO-treated larvae (E). (H) The percentage (mean ± SD) of α-cells that incorporated EdU at 48 hpa (in E-G; 6.2 ± 2.4% (DMSO), 8.0 ± 1.9% (amlexanox), and 10.9 ± 3.4% (PIAA)). Cells in 20 planes of confocal images from 10 individual larvae were counted per condition. (I) Free-glucose levels (mean ± SD) during β-cell regeneration in non-ablated wild type, DMSO-treated recovering, and TBK1/IKKε-I-treated recovering larvae. At 7 dpf (equivalent to 72 hpa), free-glucose levels were significantly lower in PIAA-treated recovering larvae (blue line, 457.7 ± 28.8 pmol/larva) than in DMSO-treated larvae (purple line, 719.3 ± 42.2 pmol/larva). *P < 0.05. n = 30 larvae (3 pools of 10 larvae) per data point. PHENOTYPE:
|
|
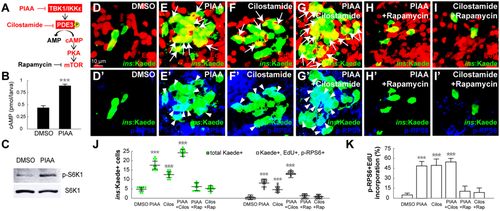
Suppression of the TBK1/IKKε-PDE3 signaling axis promotes β-cell proliferation by increasing cAMP levels and mTOR activity. (A) Schematic of the TBK1/IKKε-PDE3 signaling that modulates cAMP-PKA-mTOR pathway. The sites of inhibition by PIAA and cilostamide are shown in red. (B) Quantification of cAMP levels (mean ± SD) at 48 hpa (0.4 ± 0.1 pmol/larva (DMSO) and 0.9 ± 0.0 pmol/larva (PIAA)). (C) Representative Western blot showing increased pS6K1 levels in PIAA-treated recovering larvae. (D-I’) Confocal images of [Tg(ins:CFP-NTR)s892; Tg(ins:Kaede)jh6] larvae at 48 hpa, concurrently treated with EdU and DMSO (D-D’), PIAA (E-E’), cilostamide (F-F’), a combination of PIAA and cilostamide (G-G’), a combination of PIAA and rapamycin (H-H’), or a combination of cilostamide and rapamycin (I-I’), respectively, from 0–48 hpa, stained for pRPS6 (blue). The number of EdU-incorporated (white arrows) and pRPS6-positive (white arrowheads) β-cells was increased in recovering larvae treated with both PIAA and cilostamide (G,G’) compared to individual compound-treated larvae (E-E’ and F-F’). Rapamycin substantially suppressed the PIAA- and cilostamide-dependent increases in the number of EdU-incorporated and pRPS6-positive β-cells (H-I’). (J) Quantification of the number (mean ± SD) of total regenerated β-cells (green bars) and regenerated β-cells that incorporated EdU with pRPS6 immunoreactivity (white bars) at 48 hpa (in D-I’; 5.0 ± 1.3 total regenerated β-cells, of which 0.3 ± 0.5 (DMSO), 17.8 ± 2.8, of which 8.4 ± 1.7 (PIAA), 12.7 ± 1.9, of which 5.0 ± 1.5 (cilostamide), 24.7 ± 1.2, of which 13.3 ± 0.6 (PIAA and cilostamide), 6.0 ± 2.0, of which 1.0 ± 1.0 (PIAA and rapamycin), and 5.2 ± 1.1, of which 0.8 ± 0.8 (cilostamide and rapamycin) incorporated EdU with pRPS6 immunoreactivity). (K) The percentage (mean ± SD) of regenerated β-cells that incorporated EdU with pRPS6 immunoreactivity at 48 hpa (in D-I’; 6.1 ± 9.5% (DMSO), 47.3 ± 7.5% (PIAA), 50.4 ± 8.8% (cilostamide), 54.2 ± 4.2% (PIAA and cilostamide), 13.9 ± 12.7% (PIAA and rapamycin), and 13.7 ± 13.0% (cilostamide and rapamycin)). Cells in 20 planes of confocal images from 10 individual larvae were counted per condition. ***P < 0.001. EXPRESSION / LABELING:
PHENOTYPE:
|
|
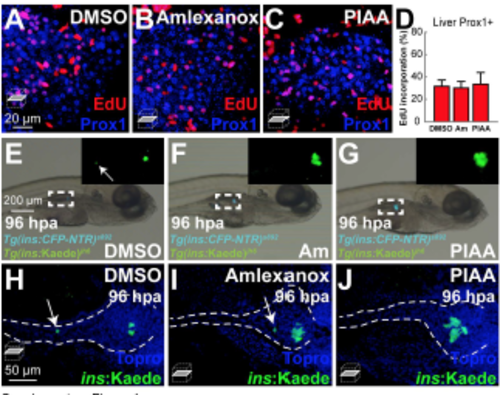
TBK1/IKKε inhibitors do not increase proliferation of liver cells nor lead to an overshoot in b-cell number. (A-C) Confocal single-plane images of [Tg(ins:CFP-NTR)s892; Tg(ins:Kaede)jh6] larvae at 48 hpa, concurrently treated with EdU and DMSO (A), amlexanox (B), or PIAA (C), respectively, from 0-48 hpa, stained for Prox1 (blue). The number of Prox1- positive cells in the liver that incorporated EdU did not significantly increase in TBK1/IKKε-Itreated recovering larvae (B and C) compared to DMSO-treated larvae (A). (D) The percentage (mean±SD) of Prox1-positive liver cells that incorporated EdU at 48 hpa (in A-C; 31.6±5.6% (DMSO), 30.1±5.8% (amlexanox), and 33.5±10.5% (PIAA)). Cells in 10 planes of confocal images from 5 individual larvae were counted per condition. (E-G) Bright-field images combined with fluorescent images showing the overall morphology of embryos and [Tg(ins:CFP-NTR)s892; Tg(ins:Kaede)jh6] expression (green) in larvae at 96 hpa treated with DMSO (E), amlexanox (F), and PIAA (G), respectively. While TBK1/IKKε-Is expanded [Tg(ins:CFP-NTR)s892; Tg(ins:Kaede)jh6]-expressing cell population (white squares and insets) during regeneration (F and G) compared to DMSO (E), a longer treatment (0-96 hpa) did not result in overproliferation of b-cells. (H-J) Confocal single-plane images of [Tg(ins:CFPNTR) s892; Tg(ins:Kaede)jh6] larvae at 96 hpa (in E-G), stained with Topro (blue). White arrows indicate b-cells located in secondary islets. |
|
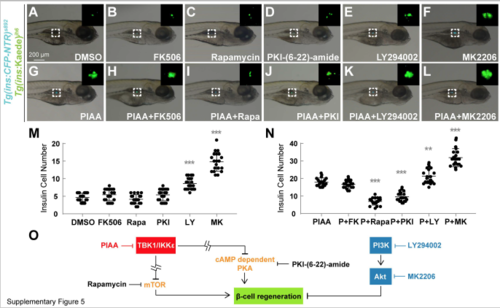
TBK1/IKKε suppression promotes b-cell regeneration via PKA and mTOR signaling axis. (A-L) Bright-field images combined with fluorescent images showing the overall morphology and [Tg(ins:CFP-NTR)s892; Tg(ins:Kaede)jh6] expression (green) of larvae at 48 hpa treated with DMSO (A), calcineurin inhibitor FK506 (B), mTOR inhibitor rapamycin (C), PKA inhibitor PKI-(6-22)-amide (D), PI3K inhibitor LY294002 (E), Akt inhibitor MK2206 (F), PIAA (G), and combinations of each inhibitor with PIAA (H-L), respectively. Treatment of rapamycin and PKI-(6-22)-amide suppressed PIAA-mediated b-cell regeneration (G vs. I and J). The individual LY294002 and MK2206 caused increase in the [Tg(ins:CFP-NTR)s892; Tg(ins:Kaede)jh6]-expressing cell population during regeneration (E and F). The combinations of LY294002 or MK2206, especially MK2206, with PIAA resulted in significant increase in b-cell regeneration (K and L) compared to individual treatments (E and F). The insets display magnified views of the pancreatic islets (outlined by the dashed squares). (M-N) Quantification of the number (mean±SD) of total regenerated b-cells at 48 hpa (in A-L; 4.7±1.2 (DMSO), 5.5±1.7 (FK506), 4.2±1.3 (rapamycin), 5.4±1.7 (PKI-(6-22)-amide), 8.7±1.7 (LY294002), 14.8±2.7 (MK2206), 17.9±2.4 (PIAA), 16.7±2.3 (PIAA with FK506), 7.0±2.1 (PIAA with rapamycin), 9.6±2.8 (PIAA with PKI-(6-22)-amide), 21.3±4.3 (PIAA with LY294002), 31.9±5.1 (PIAA with MK2206)). Cells in 20 planes of confocal images from 20 individual larvae were counted per condition. **, P < 0.01; ***, P < 0.001. (O) A model depicting the role of PKA and mTOR signaling pathways in mediating the b-cell regeneration response to TBK1/IKKε inhibition. The site of action of PIAA is shown in red, while those of LY294002 and MK2206 in blue. |
|
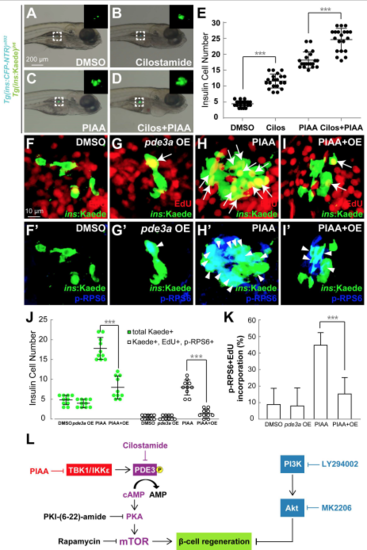
Suppression of TBK1/IKKε bestows an mTOR-mediated increase in b-cell number via PDE3. (A-D) Bright-field images combined with fluorescent images showing the overall morphology and [Tg(ins:CFP-NTR)s892; Tg(ins:Kaede)jh6] expression (green) of larvae at 48 hpa treated with DMSO (A), cilostamide (B), PIAA (C), and PIAA with cilostamide (D), respectively. The combination of cilostamide with PIAA resulted in increase in the [Tg(ins:CFPNTR) s892; Tg(ins:Kaede)jh6]-expressing cell population during regeneration (D) compared to individual treatment (B and C). The insets display magnified views of the pancreatic islets (outlined by the dashed squares). (E) Quantification of the number (mean±SD) of total regenerated b-cells at 48 hpa (in A-D; 4.5±1.0 (DMSO), 11.6±2.2 (cilostamide), 18.2±2.6 (PIAA), and 24.6±3.6 (cilostamide with PIAA). Cells in 20 planes of confocal images from 20 individual larvae were counted per condition. ***, P < 0.001. (F-I’) Confocal images of EdUadministered [Tg(ins:CFP-NTR)s892; Tg(ins:Kaede)jh6] larvae at 48 hpa, treated with DMSO (F and F’) and PIAA (H and H’), respectively, or induced pde3a expression upon b-cell ablation (G and G’) and pde3a expression upon b-cell ablation in the presence of PIAA (I and I’), respectively, from 0-48 hpa, stained for pRPS6 (blue). The number of EdU-incorporated (white arrows) and pRPS6-positive (white arrowheads) b-cells was increased in recovering larvae treated with PIAA (H and H’) compared to DMSO-treated larvae (F and F’). When pde3a expression was induced upon b-cell ablation, PIAA-dependent increases in the number of EdUincorporated and pRPS6-positive b-cells were suppressed (I and I’). (J) Quantification of the number (mean±SD) of total regenerated b-cells (green dots) and regenerated b-cells that incorporated EdU with pRPS6 immunoreactivity (white dots) at 48 hpa (in F-I’; 4.8±1.2 total regenerated b-cells, of which 0.5±0.5 (DMSO), 4.0±1.0, of which 0.4±0.5 (pde3a overexpressing), 17.8±2.8, of which 8.0±1.9 (PIAA), and 8.0±2.8, of which 1.4±1.1 (pde3a overexpressing in the presence of PIAA) incorporated EdU with pRPS6 immunoreactivity). (K) The percentage (mean±SD) of regenerated b-cells that incorporated EdU with pRPS6 immunoreactivity at 48 hpa (in F-I’; 8.9±9.8% (DMSO), 8.0±11.0% (pde3a overexpressing), 44.8±7.6% (PIAA), and 15.3±9.9% (pde3a overexpressing in the presence of PIAA)). Cells in 20 planes of confocal images from 10 individual larvae were counted per condition. ***, P < 0.001. (L) A model depicting the cAMP-PKA-mTOR signaling cascade via PDE3 that mediates b-cell regeneration in response to TBK1/IKKε inhibition. The site of action of PIAA is shown in red, while those of LY294002 and MK2206 in blue, and cilostamide in purple. |
|
PIAA increases b-cell proliferation during normal development in zebrafish. (A-B) Confocal images of [Tg(ins:CFP-NTR)s892; Tg(ins:Kaede)jh6] larvae at 6 dpf, concurrently treated EdU and DMSO (A) or PIAA (B), respectively, from 4-6 dpf. A small but significant increase in EdU incorporation (white arrows) was observed in PIAA-treated larvae (B) compared to DMSO-treated larvae (A) during normal development. (C) Quantification of the number (mean±SD) of total b-cells (green dots) and b-cells that incorporated EdU (yellow dots) (in A-B; 38.0±3.2 total b-cells, of which 5.8±1.0 (DMSO) and 45.3±9.3, of which 11.0±3.6 (PIAA) incorporated EdU). (D) The percentage (mean±SD) of b-cells that incorporated EdU (in A-B; 15.2±2.7% (DMSO) and 23.8±3.4% (PIAA)). Cells in 20 planes of confocal images from 5 individual larvae were counted per condition. *, P < 0.05. |

