
Fig. 5
- ID
- ZDB-IMAGE-181206-16
- Publication
- Xu et al., 2018 - Inhibition of TBK1/IKKε Promotes Regeneration of Pancreatic β-cells
- All Figures
- Figures for Xu et al., 2018
|
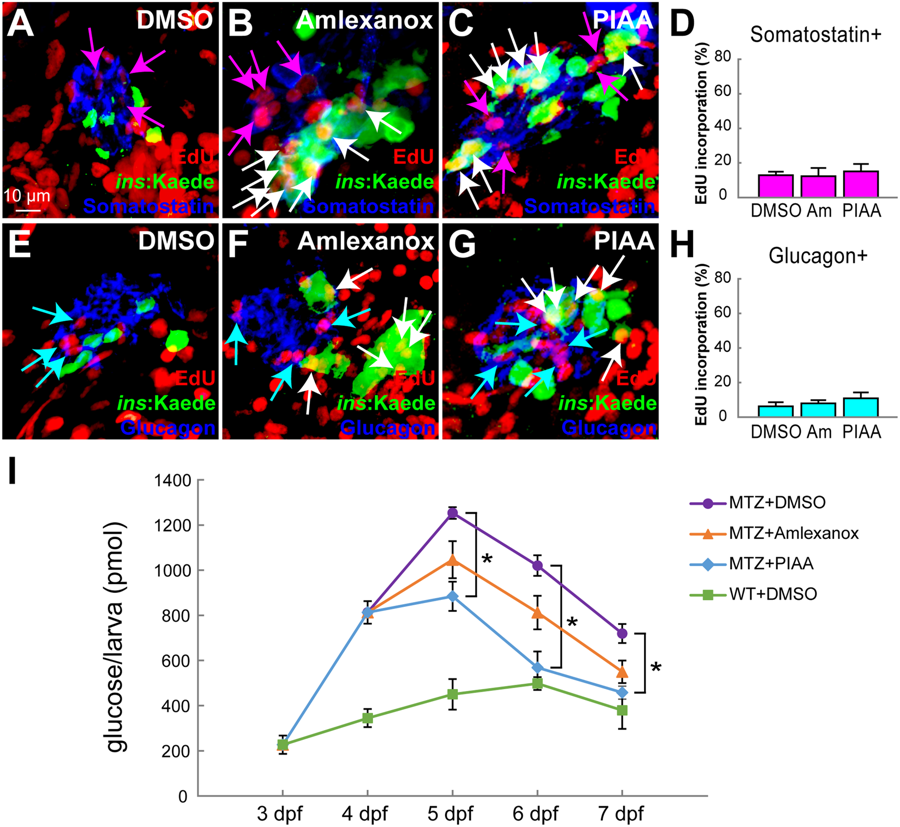
Fig. 5
TBK1/IKKε inhibitors accelerate restoration of β-cell function by selectively increasing the number of β-cells. (A–C) Confocal images of [Tg(ins:CFP-NTR)s892; Tg(ins:Kaede)jh6] larvae at 48 hpa, concurrently treated with EdU and DMSO (A), amlexanox (B), or PIAA (C), respectively, from 0–48 hpa, stained for Somatostatin (blue). The number of Somatostatin-expressing δ-cells that incorporated EdU (purple arrows) did not increase in TBK1/IKKε-I-treated recovering larvae (B, C) compared to DMSO-treated larvae (A). (D) The percentage (mean ± SD) of δ-cells that incorporated EdU at 48 hpa (in A-C; 12.9 ± 2.0% (DMSO), 12.4 ± 4.7% (amlexanox), and 15.1 ± 4.3% (PIAA)). Cells in 20 planes of confocal images from 10 individual larvae were counted per condition. (E–G) Confocal images of [Tg(ins:CFP-NTR)s892; Tg(ins:Kaede)jh6] larvae at 48 hpa, concurrently treated with EdU and DMSO (E), amlexanox (F), or PIAA (G), respectively, from 0–48 hpa, stained for Glucagon (blue). The number of Glucagon-expressing α-cells that incorporated EdU (blue arrows) did not increase in TBK1/IKKε-I-treated recovering larvae (F, G) compared to DMSO-treated larvae (E). (H) The percentage (mean ± SD) of α-cells that incorporated EdU at 48 hpa (in E-G; 6.2 ± 2.4% (DMSO), 8.0 ± 1.9% (amlexanox), and 10.9 ± 3.4% (PIAA)). Cells in 20 planes of confocal images from 10 individual larvae were counted per condition. (I) Free-glucose levels (mean ± SD) during β-cell regeneration in non-ablated wild type, DMSO-treated recovering, and TBK1/IKKε-I-treated recovering larvae. At 7 dpf (equivalent to 72 hpa), free-glucose levels were significantly lower in PIAA-treated recovering larvae (blue line, 457.7 ± 28.8 pmol/larva) than in DMSO-treated larvae (purple line, 719.3 ± 42.2 pmol/larva). *P < 0.05. n = 30 larvae (3 pools of 10 larvae) per data point.