
- Title
-
Simultaneous ultra-high frequency photoacoustic microscopy and photoacoustic radiometry of zebrafish larvae in vivo.
- Authors
- Moore, M.J., El-Rass, S., Xiao, Y., Wang, Y., Wen, X.Y., Kolios, M.C.
- Source
- Full text @ Photoacoustics
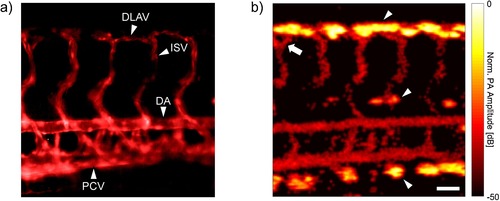
a) Fluorescence image of the GFP expressing endothelial cells in the trunk of a Tg (flk1:GFP) larval zebrafish. b) PA image of the same fish. Erythrocytes within the lumenized vessels allow for visualization of perfused vasculature. The arrow denotes a bifurcation in one of the ISVs, while the arrowheads indicate melanin spots. The scale bar is 50 μm and can be applied to both images. DLAV = Dorsal longitudinal anastomotic vessel, ISV = Intersegmental vessel, DA = Dorsal aorta, PCV = Posterior cardinal vein. |
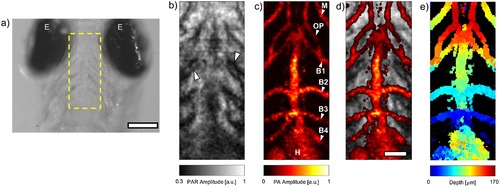
a) Brightfield image of the head of a casper zebrafish larva. The dashed box indicates the scan ROI. b) PAR image of the ROI. Arrowheads denote the pharyngeal arches. c) PA image acquired from the same dataset used to generate b). The presence of several vessels & the heart is noted. d) Composite PAR & PA image. e) Depth map of PA image. The scale bars in a) and d) are 150 μm and 50 μm, respectively. E = Eye, M = Mandibular arch, OP = Opercular artery, B1-4 = Branchial arches 1-4, H = Heart. |
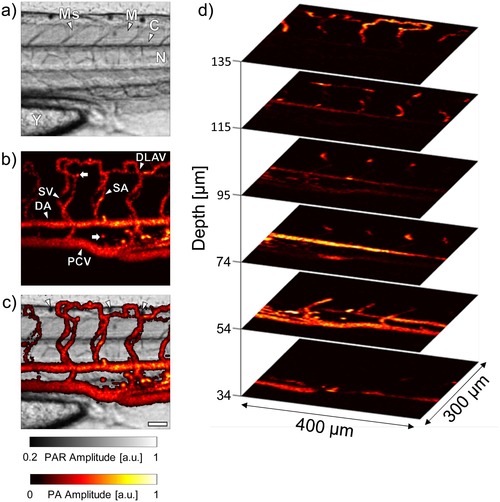
a) PAR image of the trunk of a 5 dpf casper zebrafish. b) PA image of the trunk vasculature acquired simultaneously with a). c) Composite PAR/PA image. d) PA images at different depths within the larva. The scale bar in c) is 50 μm. Ms = Myosepta, M = Myotome, C = Central canal, N = Notochord, Y = Yolk, DLAV = Dorsal longitudinal anastomotic vessel, SV = Intersegmental vein, SA = Intersegmental artery, DA = Dorsal aorta, PCV = Posterior cardinal vein. |
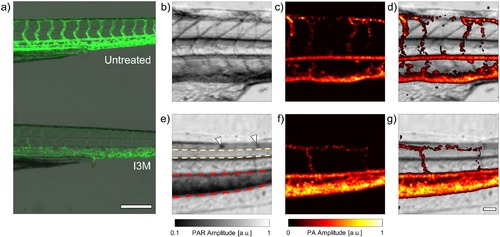
a) Fluorescence image of vasculature in the trunk of an untreated (top) and I3M treated (bottom) Tg (flk1:GFP) larval zebrafish. I3M is a potent inhibitor of angiogenesis, and fewer ISVs are formed in the treated fish. b) – d) PAR, PA, and composite images, respectively, of an untreated larva. Corresponding images for an I3M treated fish are shown in e) – g). In e), arrowheads mark the location of iridophores, while the yellow contoured area is the neural tube, and the red contoured region has an excess of RBCs. The scale bar in a) is 250 μm. The scale bar in g) is 50 μm, and can be applied to b) – g). |