
Image
|
Figure Caption
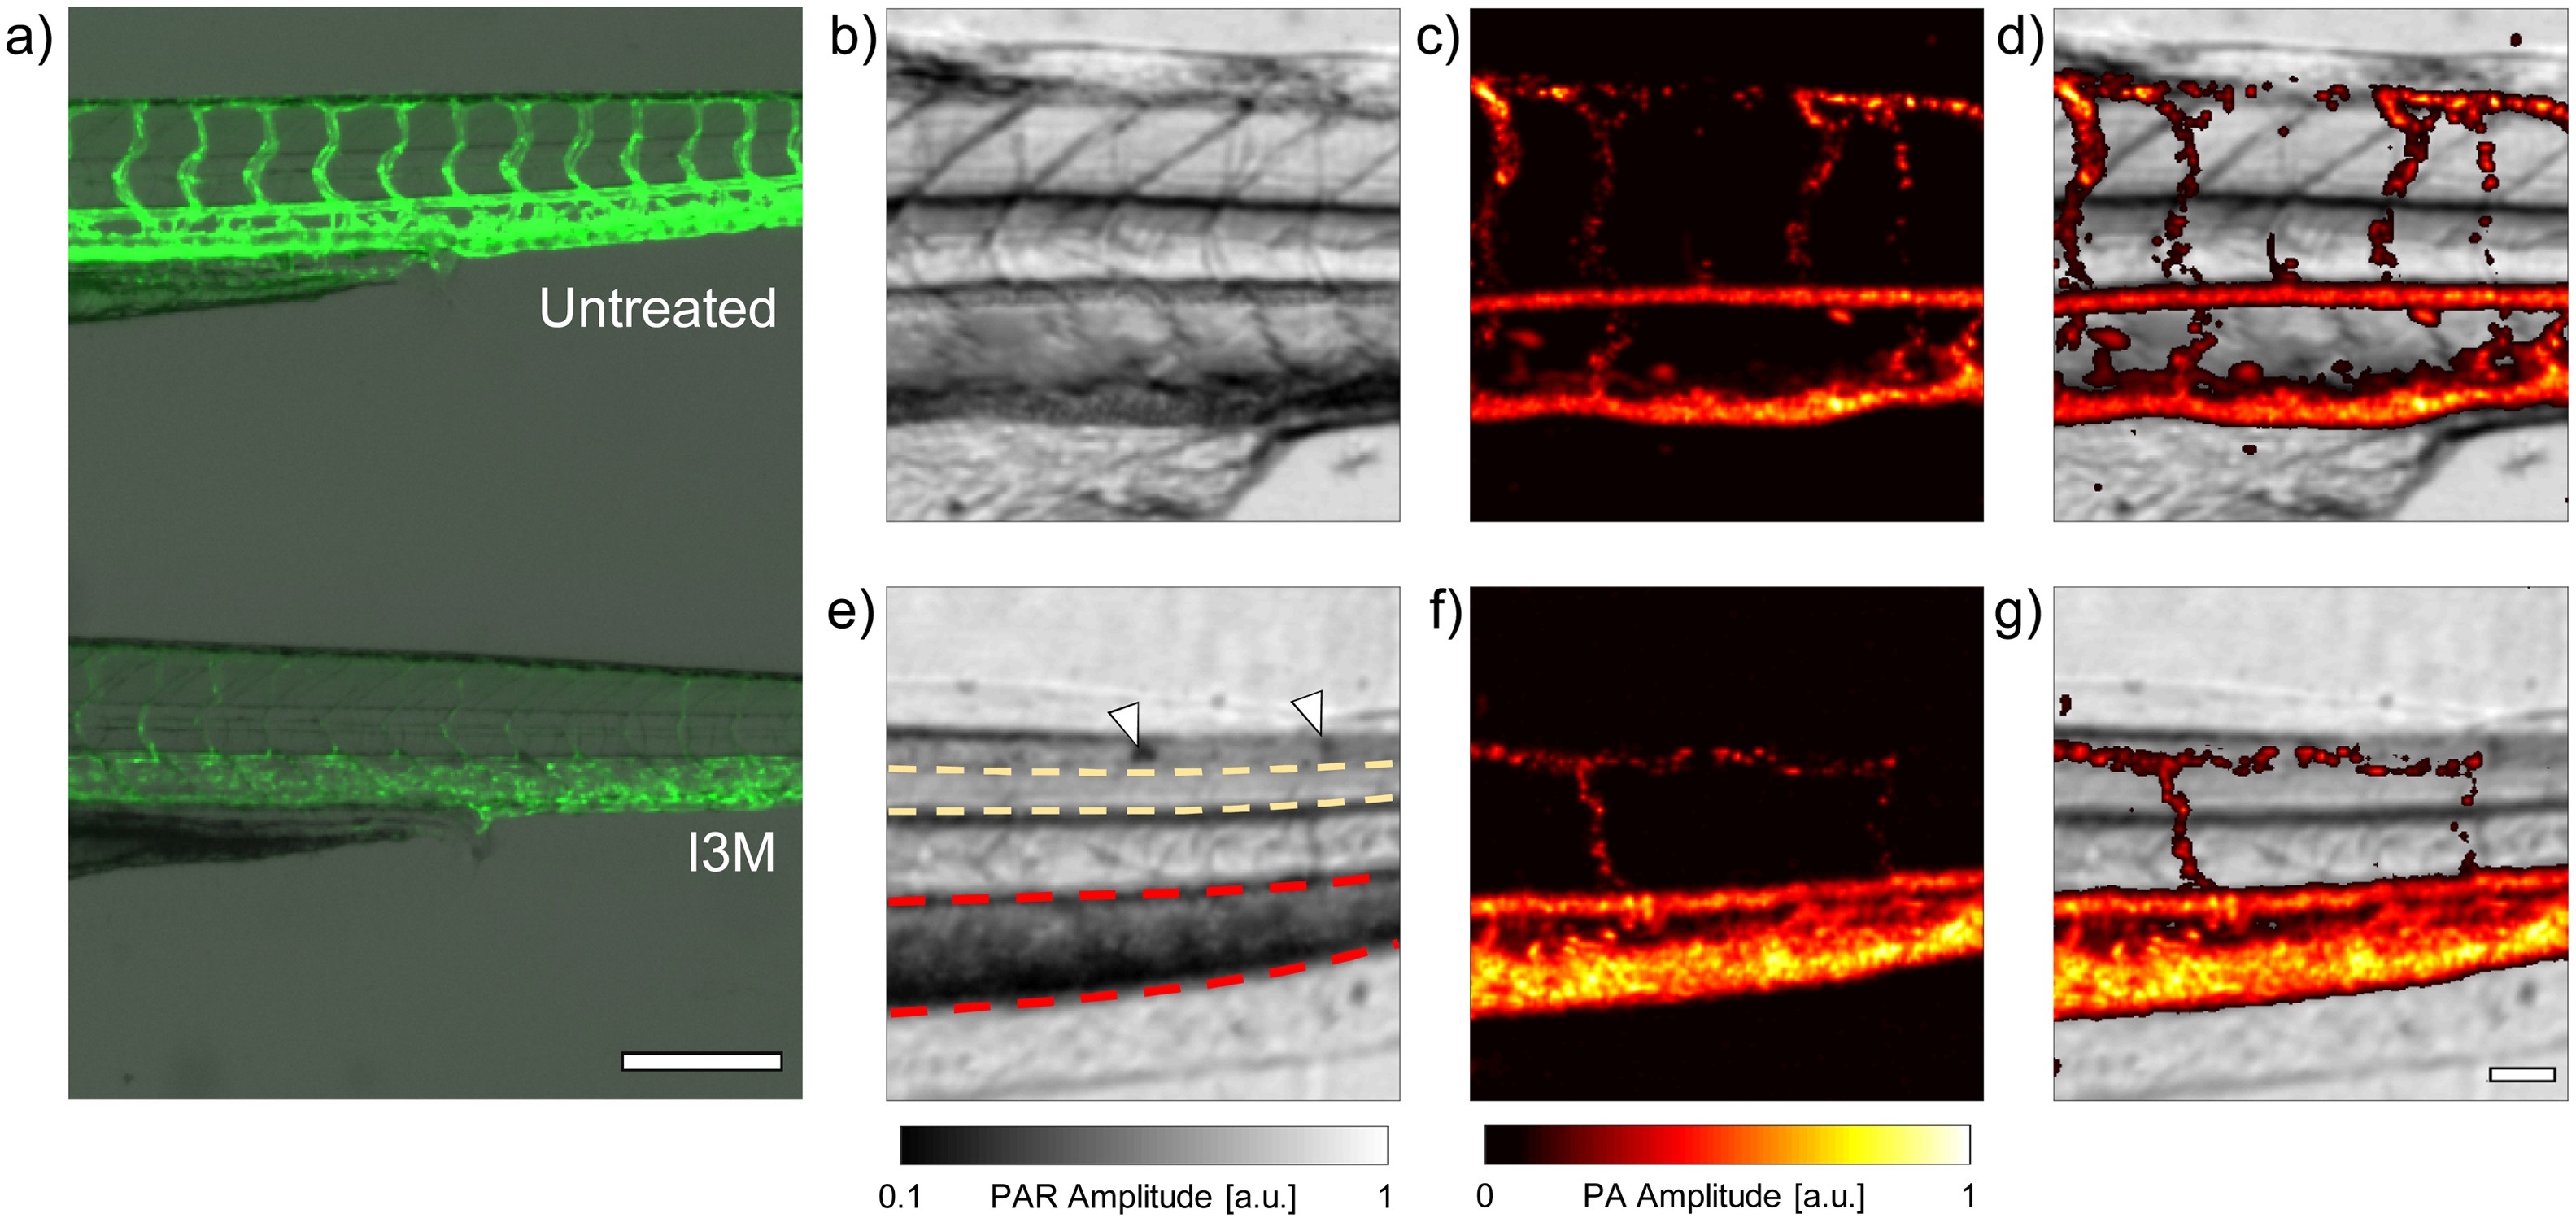
Fig. 5
a) Fluorescence image of vasculature in the trunk of an untreated (top) and I3M treated (bottom) Tg (flk1:GFP) larval zebrafish. I3M is a potent inhibitor of angiogenesis, and fewer ISVs are formed in the treated fish. b) – d) PAR, PA, and composite images, respectively, of an untreated larva. Corresponding images for an I3M treated fish are shown in e) – g). In e), arrowheads mark the location of iridophores, while the yellow contoured area is the neural tube, and the red contoured region has an excess of RBCs. The scale bar in a) is 250 μm. The scale bar in g) is 50 μm, and can be applied to b) – g).
Acknowledgments
This image is the copyrighted work of the attributed author or publisher, and
ZFIN has permission only to display this image to its users.
Additional permissions should be obtained from the applicable author or publisher of the image.
Full text @ Photoacoustics