
FIGURE
Fig. 3
- ID
- ZDB-FIG-181012-15
- Publication
- Moore et al., 2018 - Simultaneous ultra-high frequency photoacoustic microscopy and photoacoustic radiometry of zebrafish larvae in vivo.
- Other Figures
- All Figure Page
- Back to All Figure Page
Fig. 3
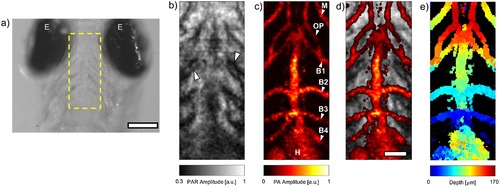
a) Brightfield image of the head of a casper zebrafish larva. The dashed box indicates the scan ROI. b) PAR image of the ROI. Arrowheads denote the pharyngeal arches. c) PA image acquired from the same dataset used to generate b). The presence of several vessels & the heart is noted. d) Composite PAR & PA image. e) Depth map of PA image. The scale bars in a) and d) are 150 μm and 50 μm, respectively. E = Eye, M = Mandibular arch, OP = Opercular artery, B1-4 = Branchial arches 1-4, H = Heart. |
Expression Data
Expression Detail
Antibody Labeling
Phenotype Data
Phenotype Detail
Acknowledgments
This image is the copyrighted work of the attributed author or publisher, and
ZFIN has permission only to display this image to its users.
Additional permissions should be obtained from the applicable author or publisher of the image.
Full text @ Photoacoustics