
- Title
-
IDH1-mutated transgenic zebrafish lines: An in-vivo model for drug screening and functional analysis
- Authors
- Gao, Y., de Wit, M., Struys, E.A., van der Linde, H.C.Z., Salomons, G.S., Lamfers, M.L.M., Willemsen, R., Sillevis Smitt, P.A.E., French, P.J.
- Source
- Full text @ PLoS One
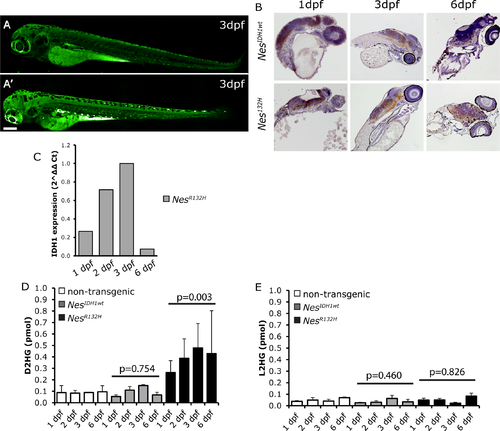
Characterization of NesIDH1 zebrafish lines. Expression of the transgene was detected in the central nervous system (CNS) of zebrafish embryos using fluorescent imaging (A: non-transgenic wildtype zebrafish showing background auto-fluorescence staining, mainly in the yolk sac; A’: NesIDH1 show expression of the transgene in the CNS of 3dpf embryos). Expression was confirmed by immunochemistry staining using an anti-GFP antibody (B) and Q-PCR (C). D2HG only accumulated in NesR132H zebrafish (D, non-transgenic vs NesIDH1wt, p = 0.754, non-transgenic vs NesR132H, p = 0.003, student’s t-test). L2HG levels in the transgenic lines showed no such increase (E). For Q-PCR experiments, we used a pool of five fish per time-point; D2HG and L2HG measurements were averages of two replicates using 5 fish per replicate. Scale bar: 200 μm. |
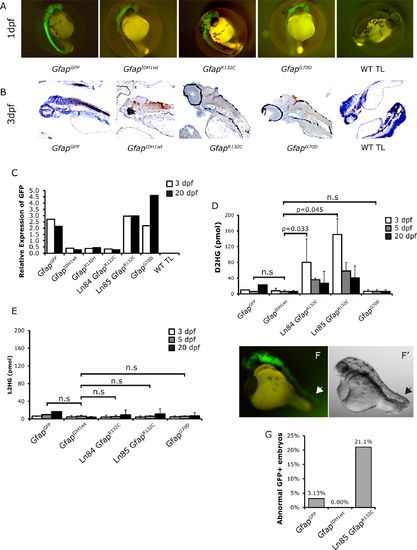
Characterization of Gfap zebrafish lines. Expression of transgene was detected using fluorescent imaging (A), immunohistochemistry with an anti-GFP antibody (B) and QPCR (C). Elevated levels of D2HG were only detected in GfapR132C lines (D). L2HG levels in the transgenic fish embryos were not affected (E). About 21% GfapR132C embryos showed defects in tail development on 1dpf (F and G). Arrow heads: the site of abnormal tail development in the GfapR132C embryos. For Q-PCR experiments, we used a pool of five (3dpf) or three (20 dpf) fish per time-point; D2HG and L2HG measurements were averages of two replicates using five (3 and 5 dpf) or three (20 dpf) fish per replicate. Scale bar: 500 μm. EXPRESSION / LABELING:
PHENOTYPE:
|

Fluorescent imaging showed expression of transgene in the central nervous system of Nestin (A) and Gfap (B) transgenic zebrafish lines on 1, 3 and 5 dpf. White arrow head: CNS-specific GFP. Yellow arrow head: auto fluorescence in the yolk sac. |
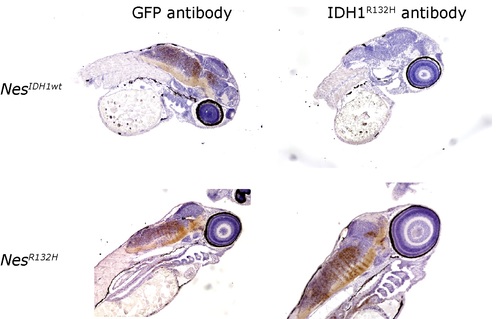
Immunohistochemistry using anti-IDH1R132H antibody demonstrated expression of IDH1R132H specific expression in Nestin zebrafish but not in IDH1wt transgenic fish. |
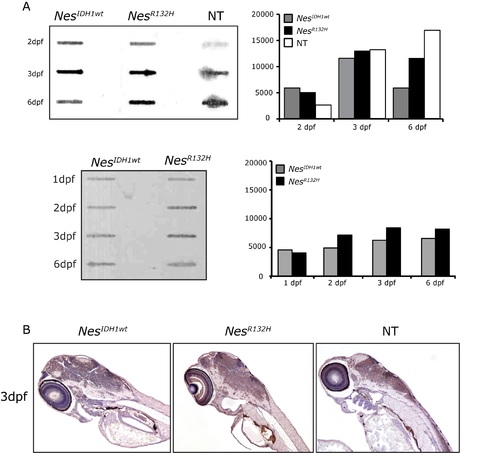
5hmC levels was not affected by high levels of D2HG in transgenic Nes R132H mutant zebrafish. A. 5hmC levels in NesIDH1wt, Nes R132H and non-transgenic zebrafish embryos were measured using slotblot stained with an 5hmC antibody (quantification of bands on the right panel). Similar results were obtained in three independent experiments one of which is shown below. B. Representative images showing 5-hmC immunostaining in NesIDH1wt, Nes R132H transgenic and non-transgenic zebrafish embryo slices at 3dpf. NT: non-transgenic zebrafish. |
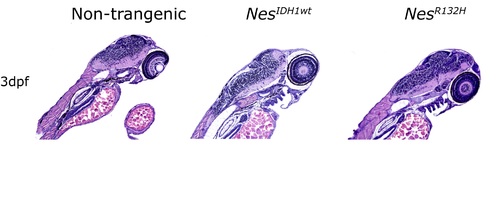
NesR132H transgenic zebrafish with CNS-accumulation of D2HG showed no gross histological abnormalities on 3dpf on H&E staining. |

Gata2GFP transgenic zebrafish shows expression in the notochord of zebrafish. Yellow arrow: In Gata2IDHwt transgenic fish the transgene is expressed in non-CNS regions (yellow arrow) whereas GfapIDH1wt transgenic fish show CNS-specific expression of transgene (white arrow). The blue arrow shows an absence of GFP signal in non-transgenic fish. |
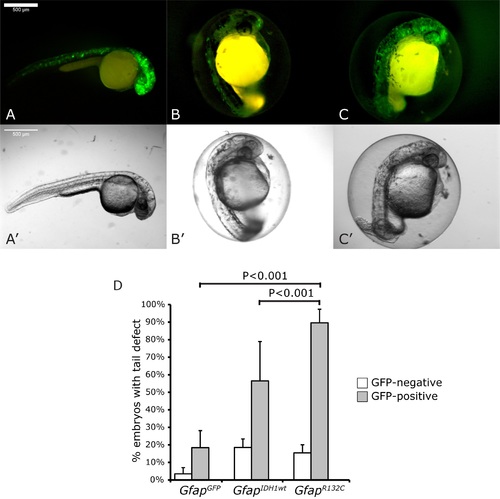
Direct injection of fertilized zebrafish embryos with Gfap constructs showed mutant-specific tail defects. Fluorescent imaging showed CNS-specific expression of injected construct GfapGFP (A), GfapIDH1wt (B) and GfapR132C(C) and the corresponding bright-field images (A’-C’). D: the percentage of GFP-positive embryos with tail defects per construct. The ratio of injected embryos with tail defect were calculated based on results of three independent experiments (~100 eggs/construct/experiment). n.s: non-significant. Scale bar: 500μm. |
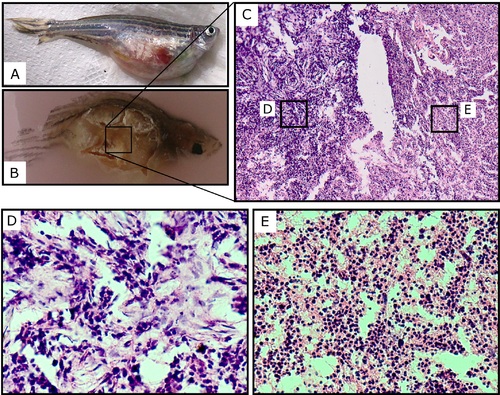
An example of a schwannoma in tp53 deficient transgenic zebrafish crossed with IDH1 transgenic fish. Euthanized 1-year old fish with a distended abdominal cavity (A). Fish were fixed in paraffin blocks (B) and sectioned slides were stained with hematoxylin/eosin for histological examination (C). D and E: enlarged images of sections in C, histological feature of tumors were consistent with the schwannomas as previously demonstrated (36). |