
Fig. 1
- ID
- ZDB-IMAGE-180824-23
- Genes
- Publication
- Gao et al., 2018 - IDH1-mutated transgenic zebrafish lines: An in-vivo model for drug screening and functional analysis
- All Figures
- Figures for Gao et al., 2018
|
Fig. 1
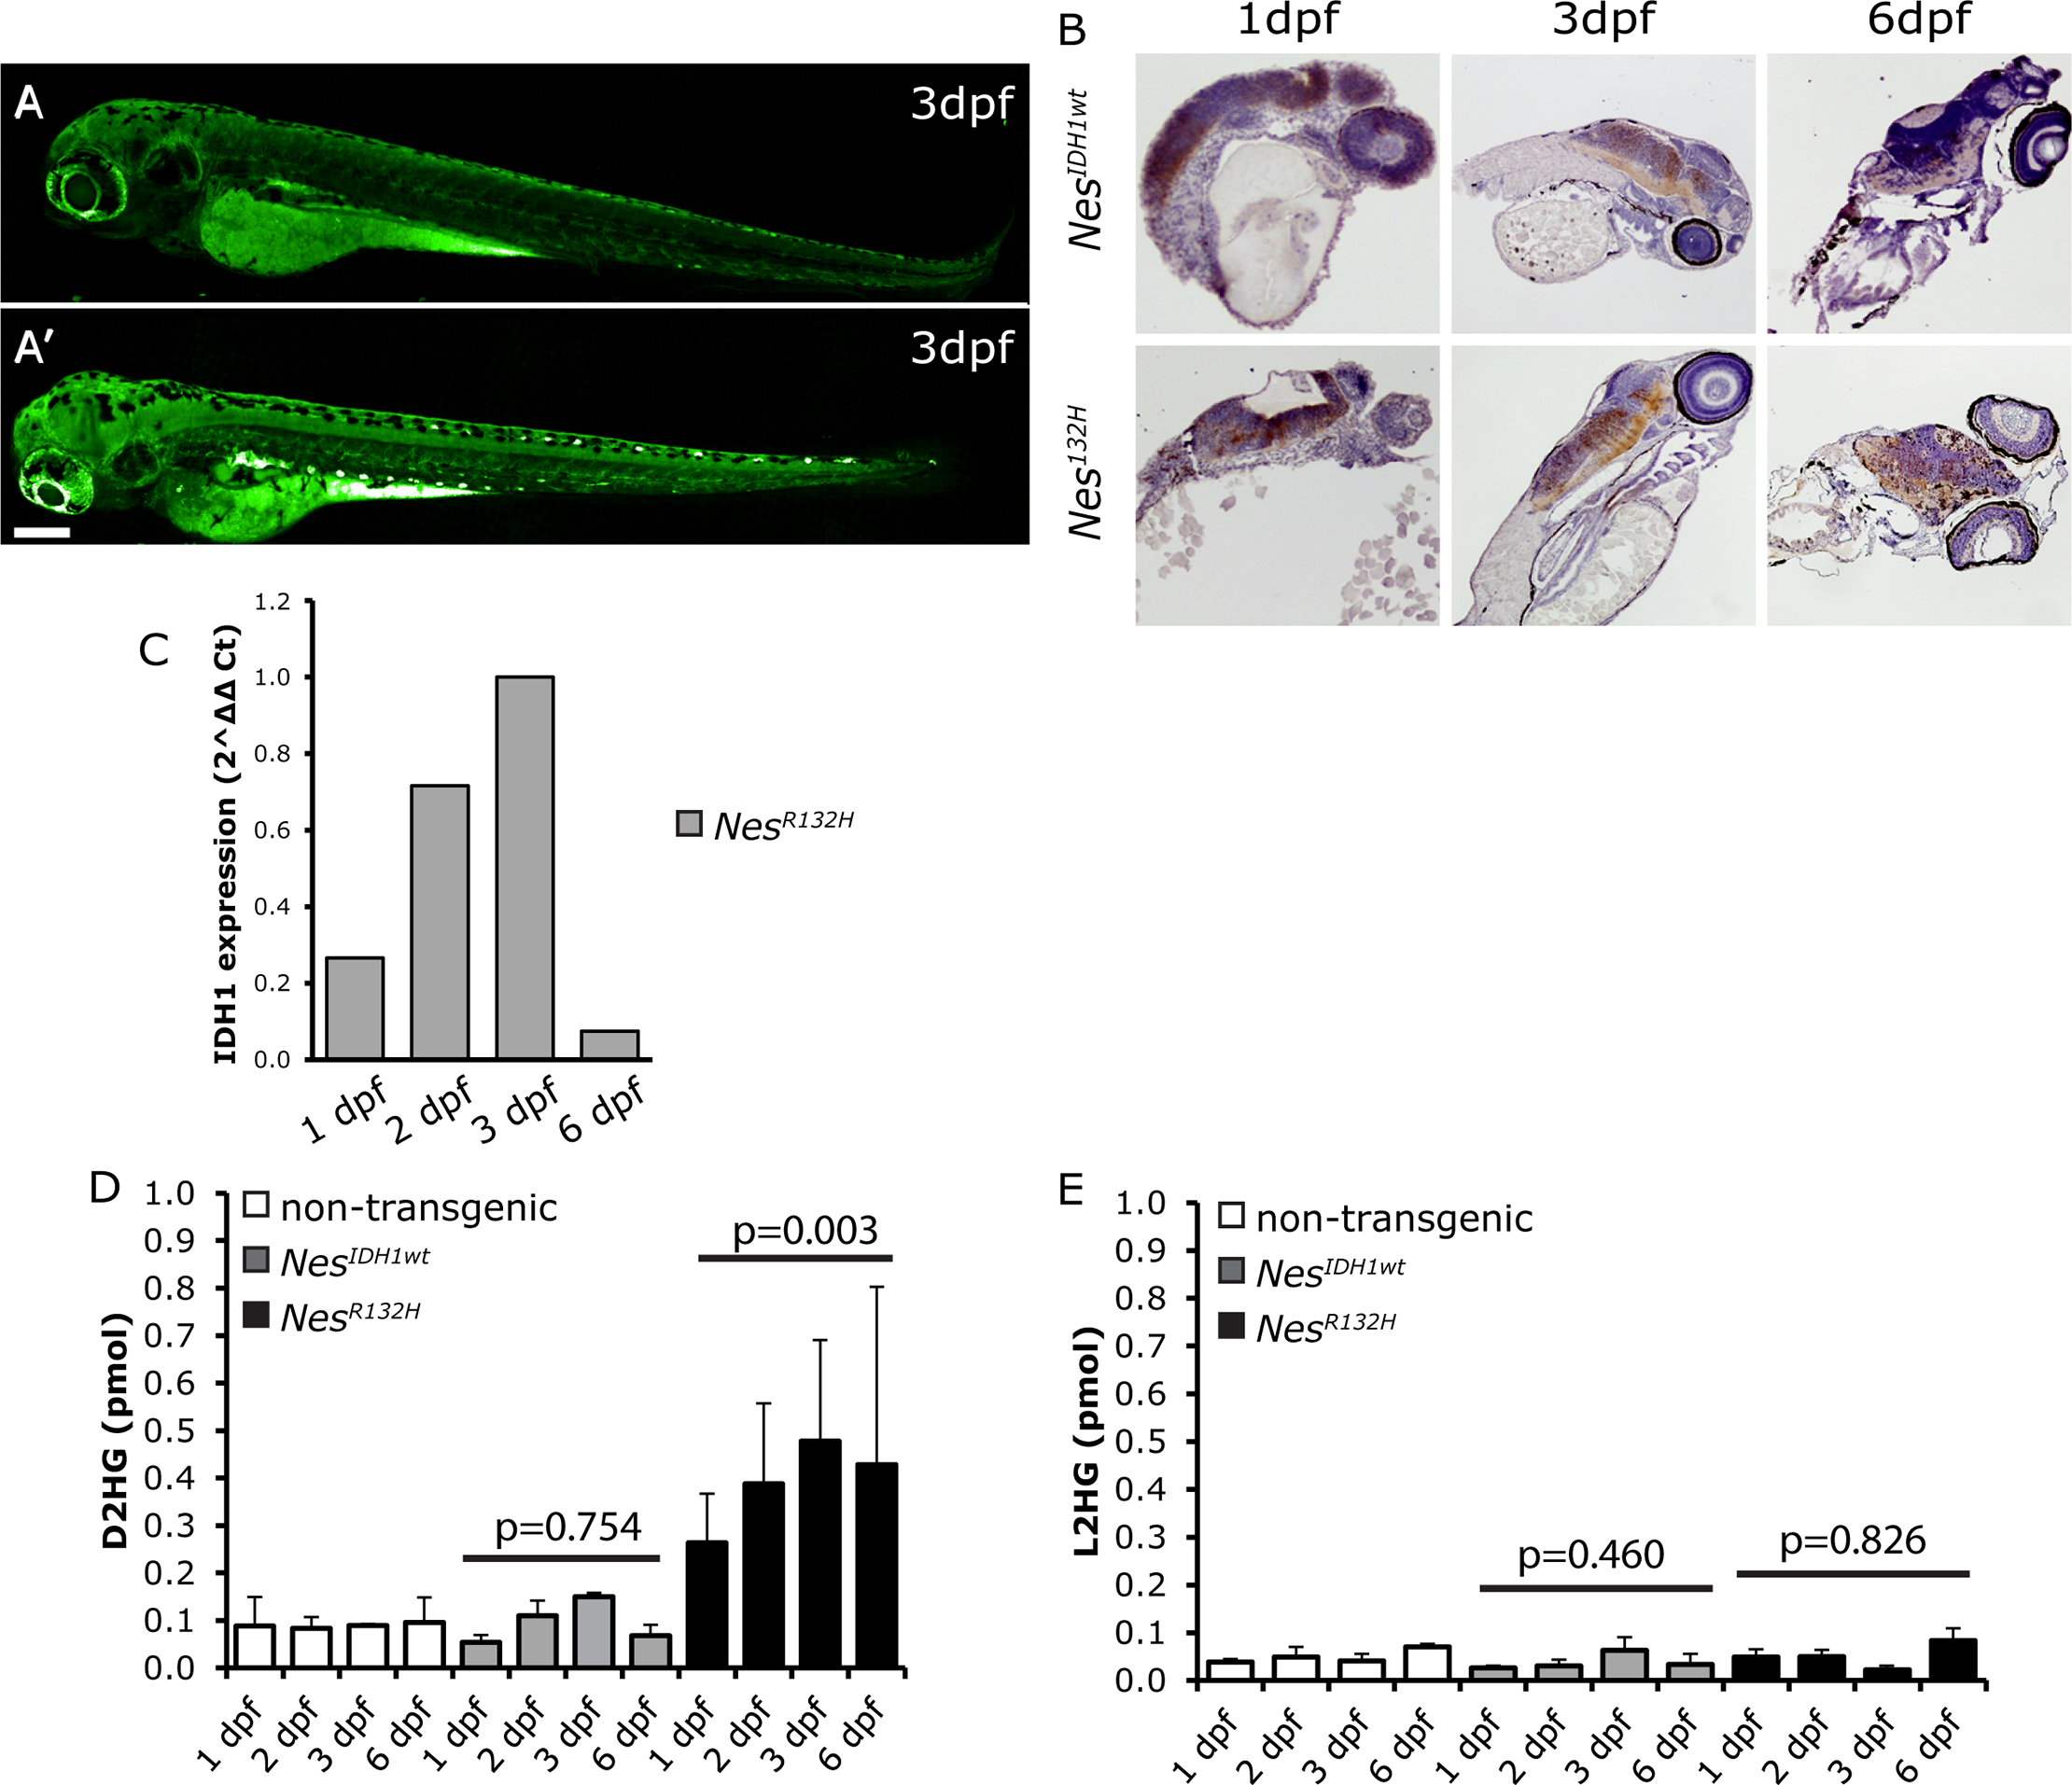
Characterization of NesIDH1 zebrafish lines.
Expression of the transgene was detected in the central nervous system (CNS) of zebrafish embryos using fluorescent imaging (A: non-transgenic wildtype zebrafish showing background auto-fluorescence staining, mainly in the yolk sac; A’: NesIDH1 show expression of the transgene in the CNS of 3dpf embryos). Expression was confirmed by immunochemistry staining using an anti-GFP antibody (B) and Q-PCR (C). D2HG only accumulated in NesR132H zebrafish (D, non-transgenic vs NesIDH1wt, p = 0.754, non-transgenic vs NesR132H, p = 0.003, student’s t-test). L2HG levels in the transgenic lines showed no such increase (E). For Q-PCR experiments, we used a pool of five fish per time-point; D2HG and L2HG measurements were averages of two replicates using 5 fish per replicate. Scale bar: 200 μm.