
Fig. 1
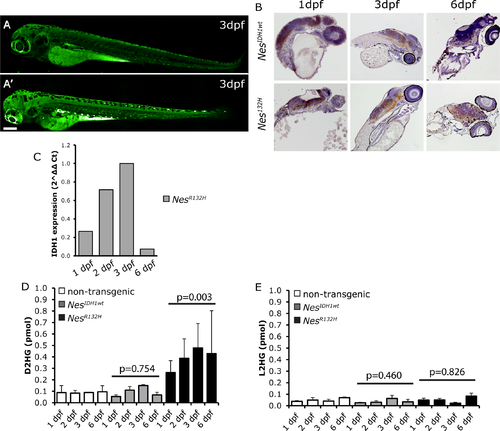
Characterization of NesIDH1 zebrafish lines. Expression of the transgene was detected in the central nervous system (CNS) of zebrafish embryos using fluorescent imaging (A: non-transgenic wildtype zebrafish showing background auto-fluorescence staining, mainly in the yolk sac; A’: NesIDH1 show expression of the transgene in the CNS of 3dpf embryos). Expression was confirmed by immunochemistry staining using an anti-GFP antibody (B) and Q-PCR (C). D2HG only accumulated in NesR132H zebrafish (D, non-transgenic vs NesIDH1wt, p = 0.754, non-transgenic vs NesR132H, p = 0.003, student’s t-test). L2HG levels in the transgenic lines showed no such increase (E). For Q-PCR experiments, we used a pool of five fish per time-point; D2HG and L2HG measurements were averages of two replicates using 5 fish per replicate. Scale bar: 200 μm. |
| Gene: | |
|---|---|
| Fish: | |
| Anatomical Terms: | |
| Stage Range: | Prim-5 to Day 6 |
| Fish: | |
|---|---|
| Observed In: | |
| Stage Range: | Prim-5 to Day 6 |