
- Title
-
Single-cell RNA-sequencing uncovers transcriptional states and fate decisions in haematopoiesis
- Authors
- Athanasiadis, E.I., Botthof, J.G., Andres, H., Ferreira, L., Lio, P., Cvejic, A.
- Source
- Full text @ Nat. Commun.
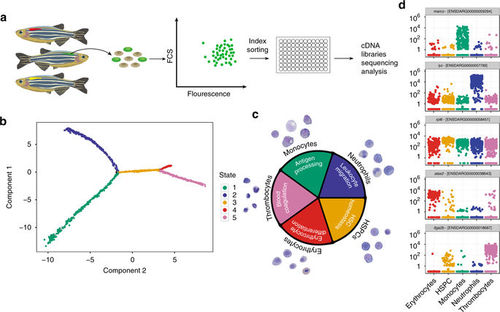
Pseudotime ordering reveals a gradual transition of cells from immature to more differentiated within the myeloid branch. a Experimental strategy for sorting single cells from transgenic zebrafish lines. Cells were collected from a single kidney of each line and sorted for expression of the fluorescent transgene. Index sorting was used to dispense single cells into a 96-well plate and these were subsequently processed for RNA-seq analyses. b Five cell states were predicted using the Monocle2 algorithm for temporal analyses of single-cell transcriptomes. c Analysis of genes that are differentially expressed across the five states (given the same colour code used in b) reveals GO terms (inner circle) that are highly pertinent to specific cell types. The outer circle shows examples of May–Grünwald Giemsa-stained cells from kidneys of transgenic lines that largely label each particular cell type. d Jitter plots showing the expression (y axis) of differentially expressed marker genes in each cell type (x axis). Each dot in the jitter plot shows the expression of the gene log10 (counts +1) in each cell |

Cells within distinct states have different repopulation potentials. a Experimental strategy for the adult transplantation experiment. Kidneys were dissected from transgenic donor fish and sorted for cells expressing the fluorescent transgene. Positive cells were collected and injected into sublethally irradiated rag2 E450fs−/− fish. b Assessment for engraftment was made 1 day, 4- and 14 weeks post transplantation using flow cytometry. Successfully engrafted fluorescent donor cells were isolated at 4 weeks PI by index sorting single cells into a microtitre plate for subsequent RNA-seq analyses. c Distribution of runx1+ cells, from non-transplanted (left) and transplanted fish at 4 (middle) and 14 wpt (right), modelled by Monocle |
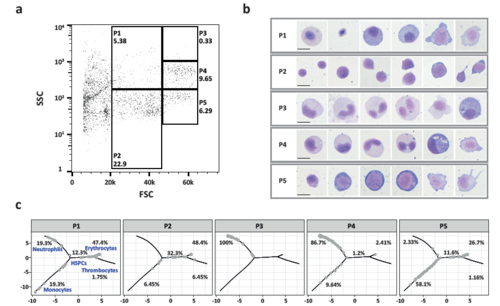
The morphological characteristics of wild type cell sub-‐populations and their distribution in Monocle2.a) Flow cytometry forward scatter/side scatter plot of the wild type whole kidney marrow, showing the gating strategy for isolating populations P1-‐ 5. The percentage of live cells in each gate is also given. The cells on the left hand side of the P1 and P2 were gated out because the majority of these cells are erythrocytes. b) The cytospins of the representative cells from P1-‐P5 stained with May-‐Grünwald Giemsa. c) The trajectories of cell states predicted by Monocle are shown in grey for P1-‐P5, with the associated cell types labelled in blue. The percentage of cells from each sub-‐population contributing to each state is given next to the relevant trajectory. |