
Fig. S7
- ID
- ZDB-FIG-180425-15
- Publication
- Athanasiadis et al., 2017 - Single-cell RNA-sequencing uncovers transcriptional states and fate decisions in haematopoiesis
- Other Figures
- All Figure Page
- Back to All Figure Page
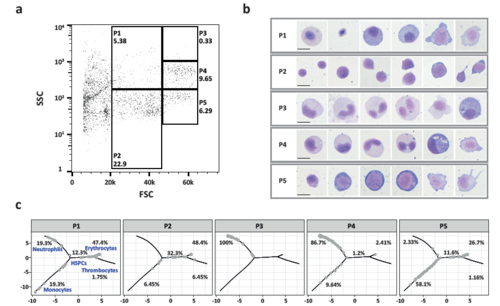
The morphological characteristics of wild type cell sub-‐populations and their distribution in Monocle2.a) Flow cytometry forward scatter/side scatter plot of the wild type whole kidney marrow, showing the gating strategy for isolating populations P1-‐ 5. The percentage of live cells in each gate is also given. The cells on the left hand side of the P1 and P2 were gated out because the majority of these cells are erythrocytes. b) The cytospins of the representative cells from P1-‐P5 stained with May-‐Grünwald Giemsa. c) The trajectories of cell states predicted by Monocle are shown in grey for P1-‐P5, with the associated cell types labelled in blue. The percentage of cells from each sub-‐population contributing to each state is given next to the relevant trajectory. |