
|
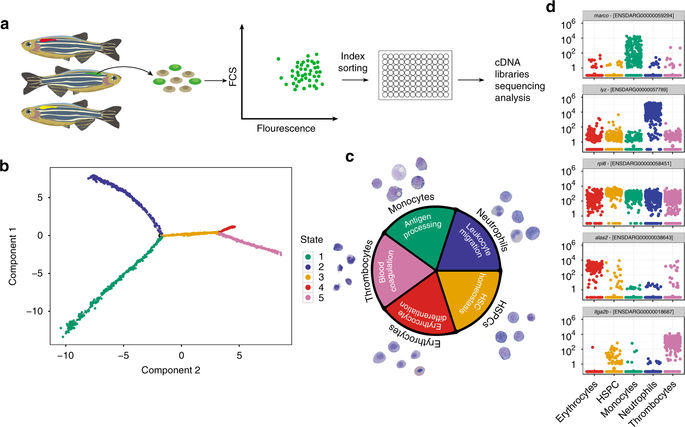
Fig. 1
Pseudotime ordering reveals a gradual transition of cells from immature to more differentiated within the myeloid branch. a Experimental strategy for sorting single cells from transgenic zebrafish lines. Cells were collected from a single kidney of each line and sorted for expression of the fluorescent transgene. Index sorting was used to dispense single cells into a 96-well plate and these were subsequently processed for RNA-seq analyses. b Five cell states were predicted using the Monocle2 algorithm for temporal analyses of single-cell transcriptomes. c Analysis of genes that are differentially expressed across the five states (given the same colour code used in b) reveals GO terms (inner circle) that are highly pertinent to specific cell types. The outer circle shows examples of May–Grünwald Giemsa-stained cells from kidneys of transgenic lines that largely label each particular cell type. d Jitter plots showing the expression (y axis) of differentially expressed marker genes in each cell type (x axis). Each dot in the jitter plot shows the expression of the gene log10 (counts +1) in each cell