
- Title
-
A method to quantify mechanobiologic forces during zebrafish cardiac development using 4-D light sheet imaging and computational modeling
- Authors
- Vedula, V., Lee, J., Xu, H., Kuo, C.J., Hsiai, T.K., Marsden, A.L.
- Source
- Full text @ PLoS Comput. Biol.
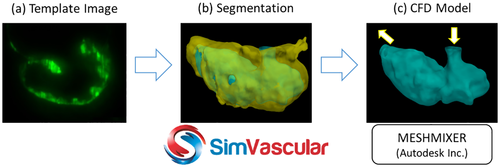
3-D image segmentation techniques in SimVascular [37] and surface tuning tools in Meshmixer (Autodesk Inc.) are leveraged to create anatomic models of the developing zebrafish endocardium for use in CFD simulations.
|
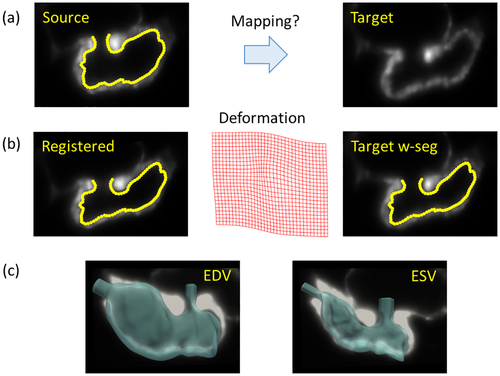
Intensity-based non-rigid deformable image registration methods are used to extract ventricular endocardial motion from 4-D light sheet image data. (a) We have chosen a source image with segmented endocardium at mid-diastole (left) and a target image at end-systole (right). (b) We perform registration using the MIRT framework to obtain the registered image (left), and compute the deformation field (middle) that is then used to morph the segmented endocardium. We note a reasonable agreement between the morphed endocardium boundary and the target image (right). (c) The registered 3D endocardial surfaces superposed on the corresponding background image are shown at end-diastolic (EDV, left) and end-systolic (ESV, right) phases of the cardiac cycle. |
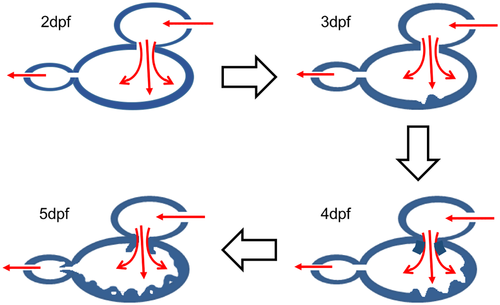
A schematic of the development of trabeculations in the wild type zebrafish. At 2dpf, we do not see any noticeable trabeculations in the ventricular myocardium. At 3dpf and 4dpf, the trabeculations are developed in the form of ridges and grooves. At 5dpf the trabeculations further developed into sponge-like network. [9] Colored arrows indicate direction of the blood flow whereas block arrows indicate progress of the developmental stages. |
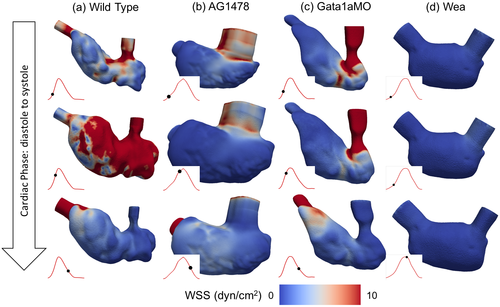
Endocardial wall shear stress (WSS) profiles are compared at different cardiac phases (rows) corresponding to early diastole, mid-diastole and mid-systole, between the wild type zebrafish embryos and in response to chemical and genetic treatments (a) wild type, (b) AG1478, (c) gata1aMO, (d) wea. The red line in each figure represents ventricular volume variation and the black dot identifies the corresponding instant during the cardiac cycle. All the phases are chosen to be at the same non-dimensionalized time with respect to the cardiac cycle duration (Tc) of each fish. This figure also illustrates the differences in ventricular morphology (volume and deformation) during the cardiac cycle for the chemically and genetically altered fish. |
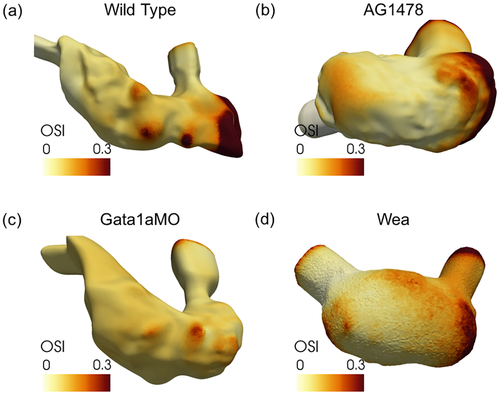
Oscillatory shear index (OSI) comparison of OSI profiles on the ventricular surface between wild type and the chemically and genetically treated zebrafish. OSI is higher in the trabecular grooves but lower in the trabecular ridges and on the rest of the smooth endocardium for the wild type. On the other hand, we observe fewer sites with high OSI for the treated fish types (AG1478, gata1aMO and wea). |