
FIGURE
Fig. 8
- ID
- ZDB-FIG-180403-33
- Publication
- Vedula et al., 2017 - A method to quantify mechanobiologic forces during zebrafish cardiac development using 4-D light sheet imaging and computational modeling
- Other Figures
- All Figure Page
- Back to All Figure Page
Fig. 8
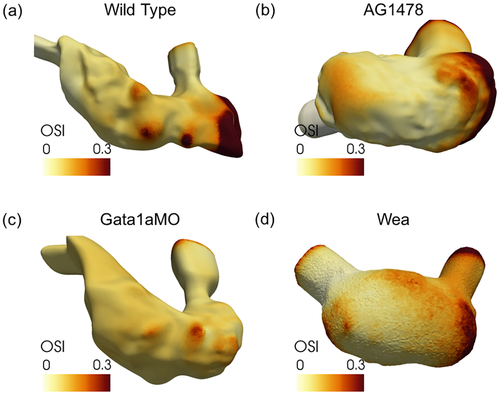
Oscillatory shear index (OSI) comparison of OSI profiles on the ventricular surface between wild type and the chemically and genetically treated zebrafish. OSI is higher in the trabecular grooves but lower in the trabecular ridges and on the rest of the smooth endocardium for the wild type. On the other hand, we observe fewer sites with high OSI for the treated fish types (AG1478, gata1aMO and wea). |
Expression Data
Expression Detail
Antibody Labeling
Phenotype Data
Phenotype Detail
Acknowledgments
This image is the copyrighted work of the attributed author or publisher, and
ZFIN has permission only to display this image to its users.
Additional permissions should be obtained from the applicable author or publisher of the image.
Full text @ PLoS Comput. Biol.