
FIGURE
Fig. 4
- ID
- ZDB-FIG-180403-31
- Publication
- Vedula et al., 2017 - A method to quantify mechanobiologic forces during zebrafish cardiac development using 4-D light sheet imaging and computational modeling
- Other Figures
- All Figure Page
- Back to All Figure Page
Fig. 4
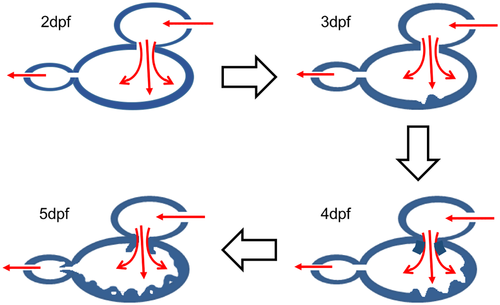
A schematic of the development of trabeculations in the wild type zebrafish. At 2dpf, we do not see any noticeable trabeculations in the ventricular myocardium. At 3dpf and 4dpf, the trabeculations are developed in the form of ridges and grooves. At 5dpf the trabeculations further developed into sponge-like network. [9] Colored arrows indicate direction of the blood flow whereas block arrows indicate progress of the developmental stages. |
Expression Data
Expression Detail
Antibody Labeling
Phenotype Data
Phenotype Detail
Acknowledgments
This image is the copyrighted work of the attributed author or publisher, and
ZFIN has permission only to display this image to its users.
Additional permissions should be obtained from the applicable author or publisher of the image.
Full text @ PLoS Comput. Biol.