
FIGURE
Fig. 6
- ID
- ZDB-FIG-180403-32
- Publication
- Vedula et al., 2017 - A method to quantify mechanobiologic forces during zebrafish cardiac development using 4-D light sheet imaging and computational modeling
- Other Figures
- All Figure Page
- Back to All Figure Page
Fig. 6
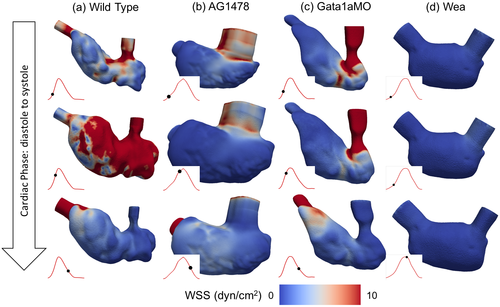
Endocardial wall shear stress (WSS) profiles are compared at different cardiac phases (rows) corresponding to early diastole, mid-diastole and mid-systole, between the wild type zebrafish embryos and in response to chemical and genetic treatments (a) wild type, (b) AG1478, (c) gata1aMO, (d) wea. The red line in each figure represents ventricular volume variation and the black dot identifies the corresponding instant during the cardiac cycle. All the phases are chosen to be at the same non-dimensionalized time with respect to the cardiac cycle duration (Tc) of each fish. This figure also illustrates the differences in ventricular morphology (volume and deformation) during the cardiac cycle for the chemically and genetically altered fish. |
Expression Data
Expression Detail
Antibody Labeling
Phenotype Data
Phenotype Detail
Acknowledgments
This image is the copyrighted work of the attributed author or publisher, and
ZFIN has permission only to display this image to its users.
Additional permissions should be obtained from the applicable author or publisher of the image.
Full text @ PLoS Comput. Biol.