
- Title
-
Sensorimotor computation underlying phototaxis in zebrafish
- Authors
- Wolf, S., Dubreuil, A.M., Bertoni, T., Böhm, U.L., Bormuth, V., Candelier, R., Karpenko, S., Hildebrand, D.G.C., Bianco, I.H., Monasson, R., Debrégeas, G.
- Source
- Full text @ Nat. Commun.

Regression-based identification of gaze-tuned neuronal populations. a Schematic of the experimental setup and regression analysis. Volumetric recordings on GCaMP6f-expressing larvae were performed using one-photon light-sheet imaging (20 sections per stack, 1 stack per second) while monitoring saccadic dynamics. Voxel-by-voxel regression with the eye orientation signals were used to produce position-tuned and velocity-tuned 3D maps. Notice that the two maps overlap in a small subset of voxels (the two 3D maps are displayed separately in Supplementary Movie 3). b, c Dorso-ventral projection view and sagittal sections along two planes of the 3D functional map (mean over 7 fish) showing neuronal populations whose activity is tuned to the gaze orientation (blue and red) and to the gaze angular velocity (green and yellow). The voxel colour encodes the Z-score values obtained through multilinear regression (Supplementary Methods). Te, telencephalon; OT, optic tectum; Cb, cerebellum; Hb, hindbrain; RH, rhombomere. The grey dotted rectangle indicates the effective recorded volume. d Coronal sections along the dotted lines shown in (c) for one sample of the four regions delineated in (b). Region 1 encompasses the saccade generator burst neurons (SGBN); region 2 is the velocity-position neural integrator (VPNI); region 3 and 4 constitute the newly identified gaze-tuned rostral hindbrain population. It consists of four bilaterally symmetric clusters tuned to the ipsiversive gaze orientation (region 3) and 2 more rostral clusters tuned to the contraversive gaze angle (region 4). e Example ΔF/F time-traces for these four regions. The red and yellow (respectively blue and green) traces correspond to the sub-populations tuned to leftward (respectively rightward) gaze orientation. The grey lines are the gaze angle traces (−θ gaze: solid line, θ gaze: dashed line). f Corresponding mean peri-saccade ΔF/F signals, computed over the leftward (red) and rightward (blue) saccades. Grey lines are peri-saccadic signals for individual saccades |

Self-oscillatory dynamics and optogenetically evoked saccades. a Dorso-ventral projection of the gaze-tuned (top-half, N = 7 fish) and self-oscillatory hindbrain population (bottom-half, N = 8 eye-fixed fish). In the latter, the colour encodes tuning to the left (red) and right (blue) pre-selected neuronal clusters, revealing strong antiphasic activity (Supplementary Methods). The two functional maps were registered on the same reference brain to enable side-by-side comparison. The rectangle indicates the region of the rostral hindbrain gaze-tuned population. b Coronal sections of the self-oscillatory population along the dotted lines in the projected view. c Pearson correlation matrix of the neurons engaged in the self-oscillatory dynamics (616 neurons). The matrix was reordered to reveal two highly correlated (and reciprocally anti-correlated) clusters. d Activity of the left vs. right populations (r = −0.43). e Example ΔF/F traces of the left and right groups (top), and of the differential signal (bottom). The grey dotted line shows cos(φ(t))), where φ(t) is the oscillatory phase extracted using Hilbert’s transform. f ΔF/F of the right (blue) and left (red) circuits as a function of the oscillatory phase. The blue and red lines correspond to the mean values. g PDF of the instantaneous oscillation period. h–k Optogenetic activation of ocular saccades. h Schematic of the optogenetic stimulation protocol. i Top: projective view of the previously mapped gaze-tuned regions. Bottom: Z-score map of saccadic entrainment by optogenetic activation averaged over 8 fish (Supplementary Methods). j Mean peri-stimulation normalised gaze signal for three regions: the rostral HBO (rh 2–3), the SGBN (rh 5), a control region (rh 7). The responses of four different fish are shown, and the associated targeted areas are indicated in (i). The 2.75 s-long stimulation periods are indicated by the grey area. k Example gaze signals upon periodic left or right optogenetic stimulation for two region pairs in rh 2–3 and rh 5. l Profile plot of the mean optogenetic Z-score along the rostro-caudal axis (black), overlaid on the ipsiversive (red) and contraversive (blue) gaze-tuned Z-score yellow curve indicates the ipsiversive velocity-tuned Z-score. Ipsiversive saccades are evoked with comparable efficiency by targeting the SGBN (rh 5) or the rostral HBO (rh 2–3) |

Response of the HBO to asymmetric and symmetric visual stimuli. a Schematic of the two-photon light-sheet imaging setup with stereo-visual stimulation. b Comparison of the gaze-tuned and visual response projection maps. Top: the red and blue colours encode leftward and rightward gaze-tuning Z-score, respectively (N = 7 fish). Bottom: the red and blue colours encode the visual response Z-score (Supplementary Methods) to unilateral stimulation on the left and right eye, respectively (N = 11 fish). The HBO circuit (white rectangle) is engaged in both sensory and motor processing. c Coronal sections of the visual response map along the two dotted lines shown in (a). In (b) the dotted rectangle delineates the recorded volume. d Alternated unilateral visual stimulation. e Example traces of left and right HBO. f Trial-averaged response of the HBO over 20 stimulation periods. Shaded regions correspond to left (dark grey) and right (pale grey) illumination. g Bilaterally symmetric 100 ms-long flashes. h Example traces of the right and left HBO. The grey lines indicate the flashes. i Trial-averaged flash-induced responses of each subpopulation (100 flashes). j Left vs. right HBO responses (1311 flashes, N = 12 fish, r = −0.5). k Phase-dependent response of each subpopulation to symmetric flashes. l Time-evolution of the HBO oscillatory phase φ(t). The slope of the green line corresponds to the stimulation frequency (period T stim = 10 s). The HBO is entrained at half the frequency of the stimulation (period 2T stim). m PDF of the HBO stimulation phase offset δφ. The inset shows the PDF of the HBO phase at times where the flashes were delivered. Notice that in (f), (i) and (k), the error bars indicate the s.e.m |
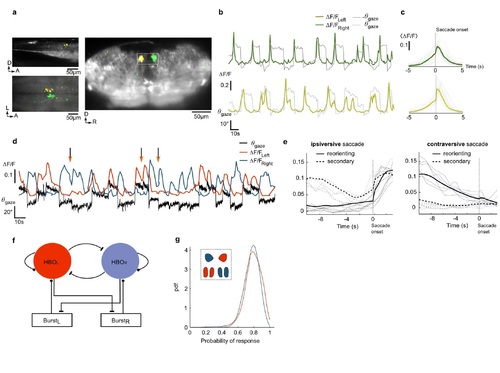
Long-lead burst neurons, HBO activity during secondary saccades and putative circuit architecture. a, Sections of the velocity-tuned map (averaged over seven fish) showing the long-lead burst neurons located in two well-defined clusters in the dorsal region of rh 7. b, Example traces of these two clusters and associated gaze signals. c, Mean peri-saccadic signals. A systematic increase of activity is observed ~2-3 s before the ipsiversive saccade onset. d-e, Secondary saccades. d, Example traces of the left- and right-HBO activity and the gaze signal. When two successive saccades occur in the same direction (arrows), the active circuit displays a transient rebound. e, Mean peri-saccade signals of the HBO subnetworks for reorienting saccades (solid line) and secondary saccades (dashed line). The data are shown separately for ipsiversive (left) and contraversive (right) saccades. f, Scheme of a putative network architecture accounting for the HBO self-oscillatory dynamics and its interaction with the saccade generator circuit (burst cells). Each HBO subcircuit send inhibitory projections to the contralateral burst cells. It receives afferent excitatory inputs from ipsilateral burst neurons. g, Robustness of the HBO gaze-tuned characteristics. For each voxel of the right (blue) and left (red) HBO, we computed the fraction of ipsiversive saccades for which a significant post-saccadic increase in Δ/ (larger than one standard deviation) is observed. The plot shows the PDF of this quantity for all the HBO voxels. |

Delineating the self-oscillatory circuit in eyes-fixed experiments. a, Pre-selected volume encompassing the gaze-tuned rostral hindbrain circuit. The rostral border of the 100x60x27μm volume is positioned 28 μm from the hindbrain constriction axis. b, Pearson correlation matrix (top) and correlation histogram (bottom) of the neuron pairs within the preselected volume. c, Neurons engaged in the 10 most highly anti-correlated pairs. d, Reference signals are computed as the the mean ΔF/F of the left and right previously selected neurons, and then used as regressors to map the self-oscillatory network across the entire volume. e, Zprojection of the resulting self-oscillatory hindbrain network (N=8 fish). Color encodes tuning (Zscore) to the left (red) and right (blue) reference signals. |

Gaze-tuned maps in the absence of visual stimulation and comparison between gaze-tuned, visually responsive and self-oscillatory maps. a, Two dorso ventral sections of gaze-tuned maps obtain on two different fish under 2-photon light-sheet imaging. Experiments were performed in the absence of visual stimulation. b, Comparison on the same fish, for two different brain sections, of the self-oscillatory hindbrain population (left) and the visually responsive neurons (right). The white contour line delineates the self-oscillatory region, i.e. the voxels that display a Z-score>3.5 when correlating with the reference oscillatory signal (see Supplementary Methods). c, Comparison on the same fish, for two different brain sections, of the self-oscillatory hindbrain population (left) and the gaze-tuned neurons (right). The white contour line is defined as in b. These data were obtained by performing experiments with a larva whose eyes were successively tethered then free. |

Optogenetic assay. a, Schematic layout of the optogenetic experiment. A checkerboard pattern is drawn over the brain image and the rectangles are sequentially displayed on a digital mirror device (DMD). The pattern on the DMD is imaged via the lenses L1 (f=40 mm) and L2 (f=80 mm) onto a confocal plane (dashed line) of the epifluorescent light path and ultimately onto the targeted region of the fish brain. A total internal reflection prism (TIR) is used to illuminate the DMD with the stimulation light source (LED). The beam splitting mirror M1 (30% reflection, 70% transmission) allows one to simultaneously use a halogen light source for epifluorescence illumination and simultaneous eyes monitoring. Camera recording and optogenetic activation are synchronized by the computer. b, Schematic description of the morphological registration method used to merge different optogenetic experiments and to overlay the activated regions onto the gaze-tuned functional map. c, Sections of one photoconverted volume using a Tg(HuC:gal4; UAS:Kaede) larva. Pixel intensity represents the red/green flurescence ratio. The larva was exposed to UV illumination using the same illumination pattern as in the optogenetic assay, but for 7 regions only. d, Sections of the average illumination volume, obtained by registrating 5 larvae, i.e. 35 volumes in total. The pixel intensity denotes the red/green fluorescence ratio normalized between 0 (outside the volume) and 1 (at the center). The isovalue line corresponding to 0.5 is shown in red. In c and d, the dotted blue rectangle indicates the targeted area. |