
|
Fig. S6
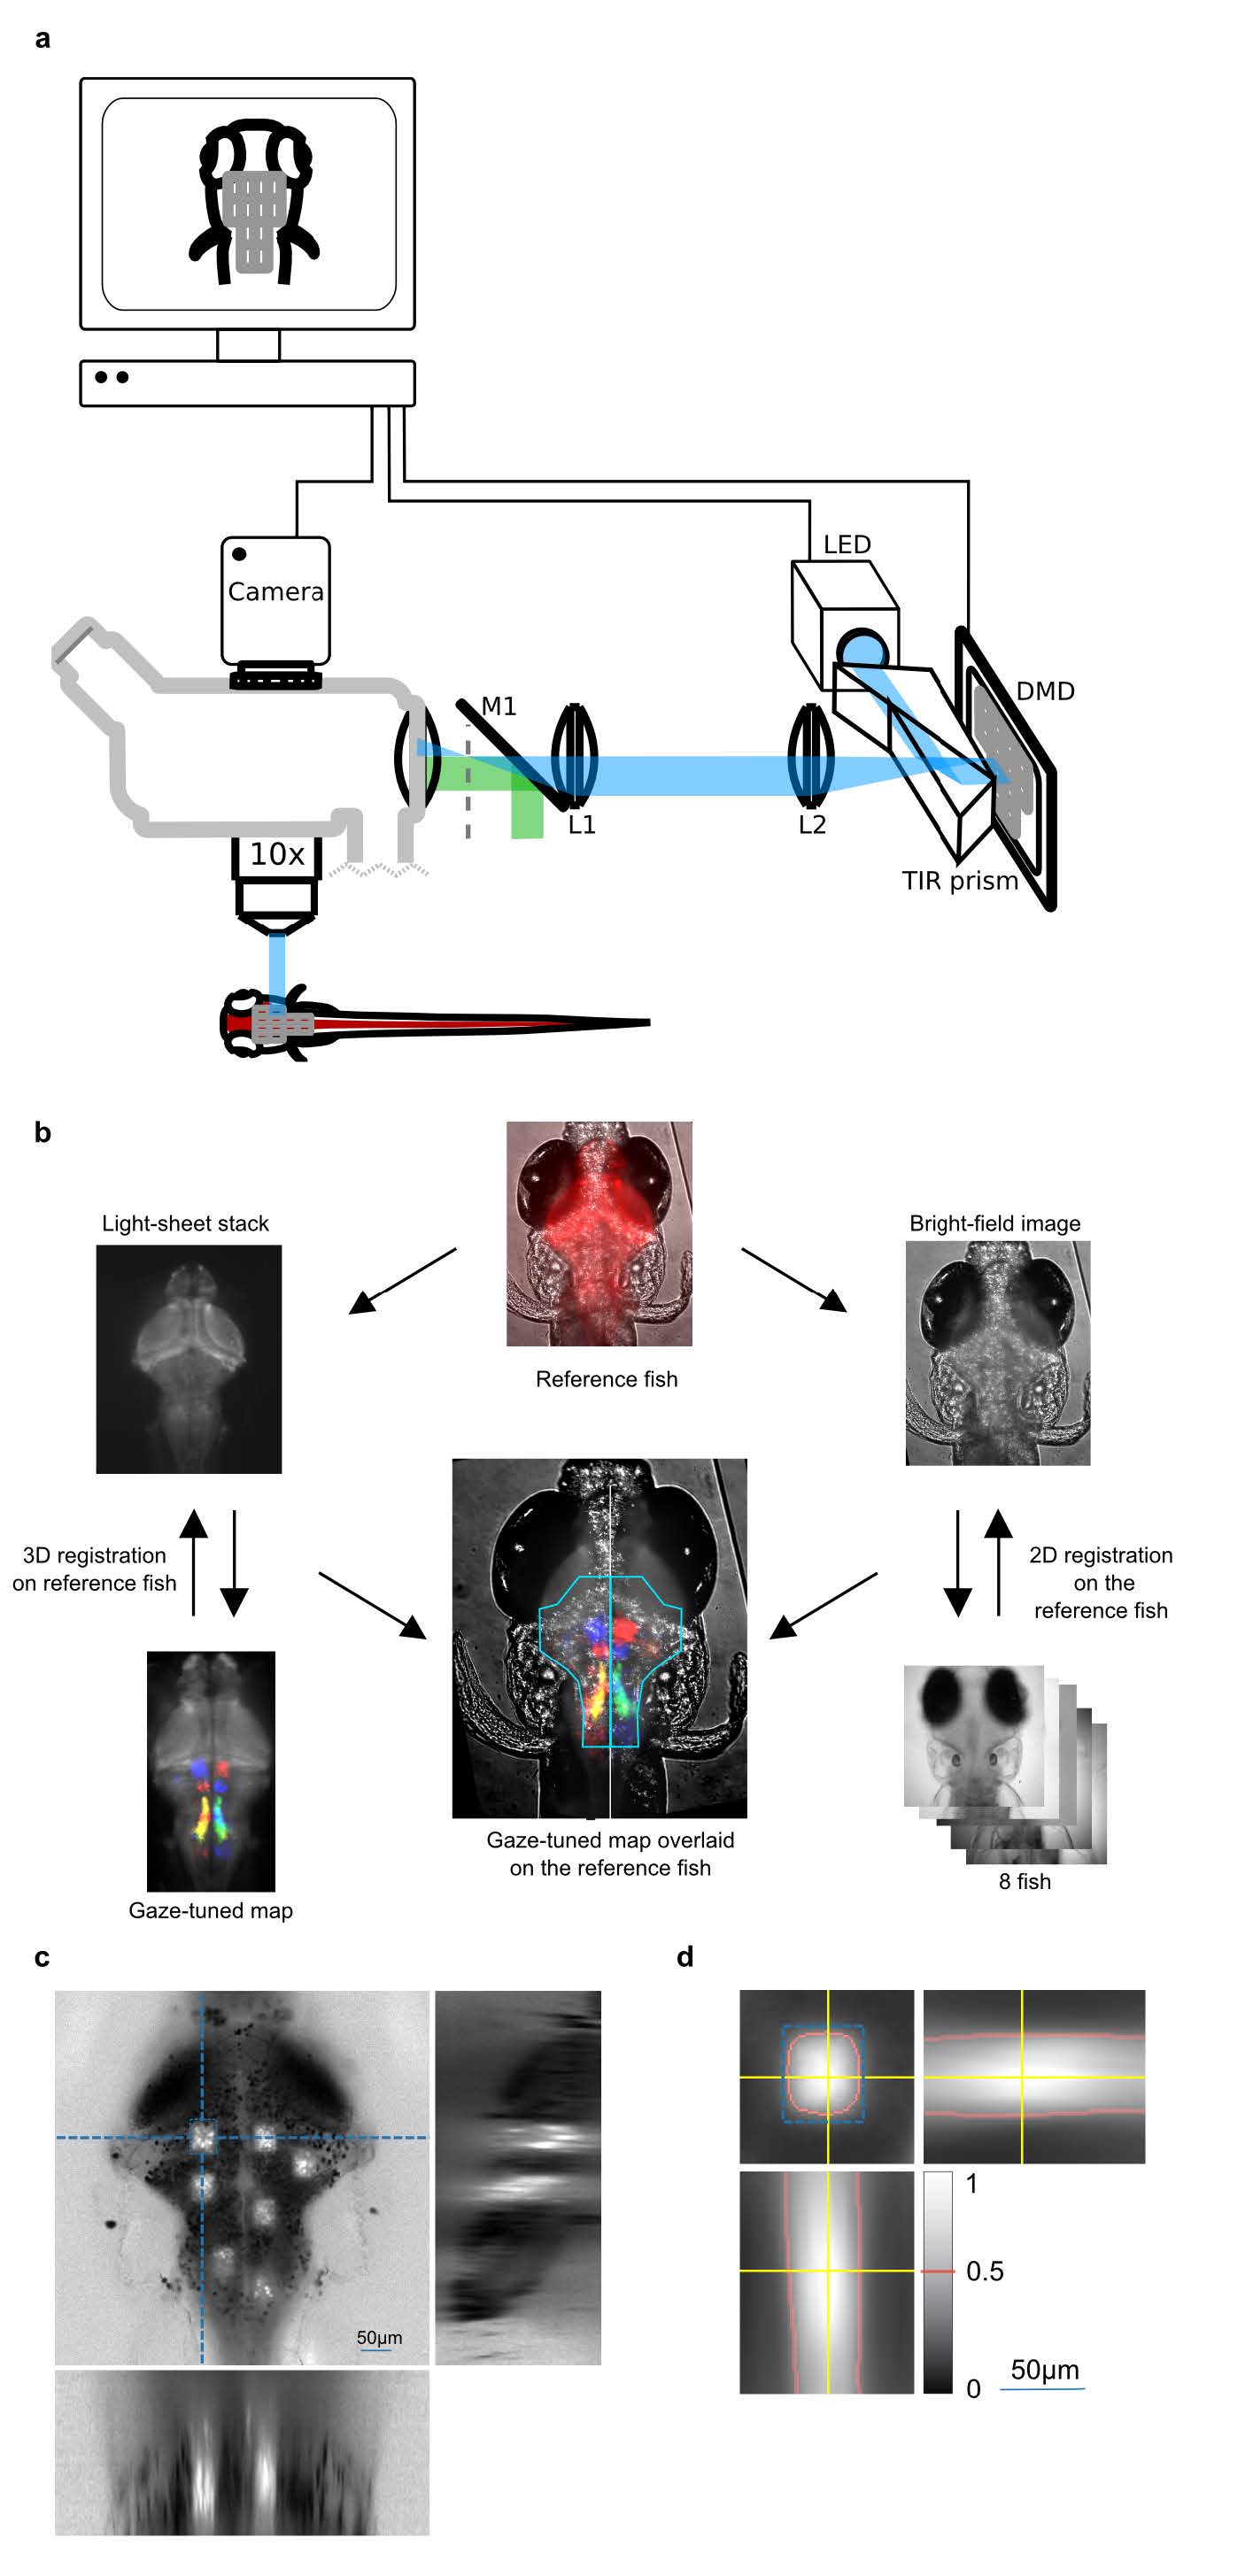
Optogenetic assay.
a, Schematic layout of the optogenetic experiment. A checkerboard pattern is drawn over the brain image and the rectangles are sequentially displayed on a digital mirror device (DMD). The pattern on the DMD is imaged via the lenses L1 (f=40 mm) and L2 (f=80 mm) onto a confocal plane (dashed line) of the epifluorescent light path and ultimately onto the targeted region of the fish brain. A total internal reflection prism (TIR) is used to illuminate the DMD with the stimulation light source (LED). The beam splitting mirror M1 (30% reflection, 70% transmission) allows one to simultaneously use a halogen light source for epifluorescence illumination and simultaneous eyes monitoring. Camera recording and optogenetic activation are synchronized by the computer. b, Schematic description of the morphological registration method used to merge different optogenetic experiments and to overlay the activated regions onto the gaze-tuned functional map. c, Sections of one photoconverted volume using a Tg(HuC:gal4; UAS:Kaede) larva. Pixel intensity represents the red/green flurescence ratio. The larva was exposed to UV illumination using the same illumination pattern as in the optogenetic assay, but for 7 regions only. d, Sections of the average illumination volume, obtained by registrating 5 larvae, i.e. 35 volumes in total. The pixel intensity denotes the red/green fluorescence ratio normalized between 0 (outside the volume) and 1 (at the center). The isovalue line corresponding to 0.5 is shown in red. In c and d, the dotted blue rectangle indicates the targeted area.