
|
Fig. S4
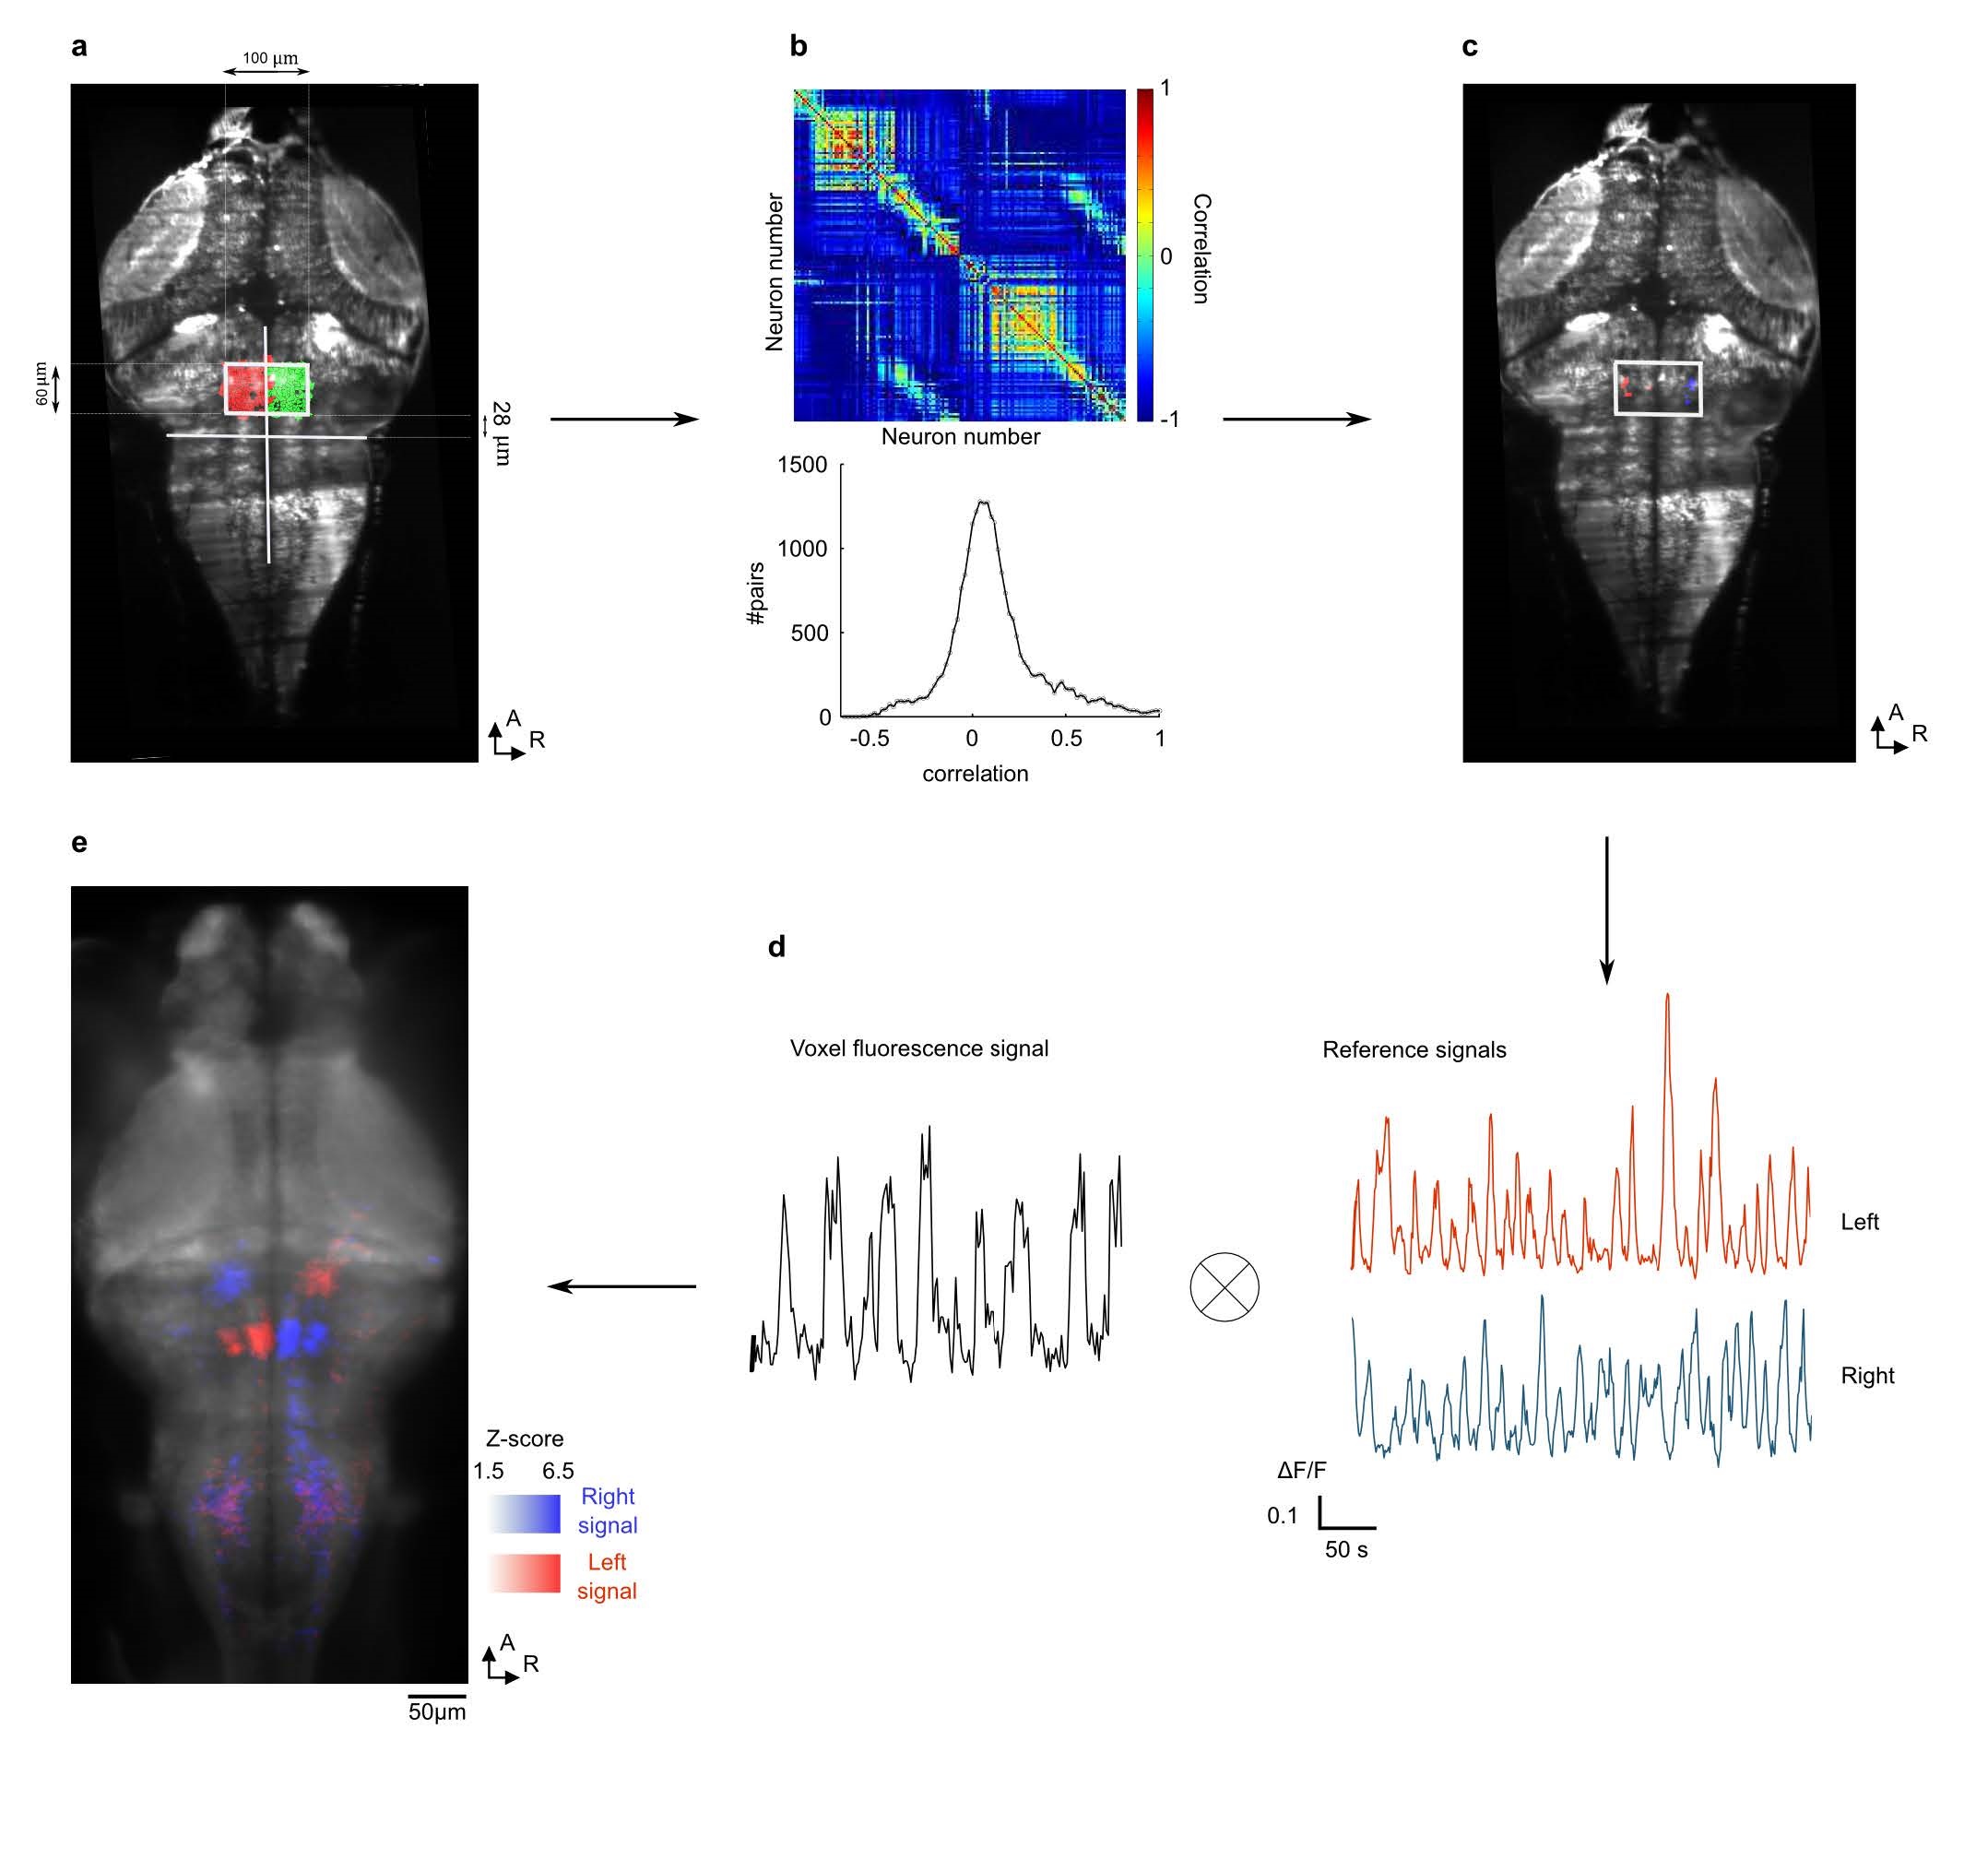
Delineating the self-oscillatory circuit in eyes-fixed experiments.
a, Pre-selected volume encompassing the gaze-tuned rostral hindbrain circuit. The rostral border of the 100x60x27μm volume is positioned 28 μm from the hindbrain constriction axis. b, Pearson correlation matrix (top) and correlation histogram (bottom) of the neuron pairs within the preselected volume. c, Neurons engaged in the 10 most highly anti-correlated pairs. d, Reference signals are computed as the the mean ΔF/F of the left and right previously selected neurons, and then used as regressors to map the self-oscillatory network across the entire volume. e, Zprojection of the resulting self-oscillatory hindbrain network (N=8 fish). Color encodes tuning (Zscore) to the left (red) and right (blue) reference signals.