
- Title
-
Three-dimensional structural analysis reveals a Cdk5-mediated kinase cascade regulating hepatic biliary network branching in zebrafish
- Authors
- Dimri, M., Bilogan, C., Pierce, L.X., Naegele, G., Vasanji, A., Gibson, I., McClendon, A., Tae, K., Sakaguchi, T.F.
- Source
- Full text @ Development
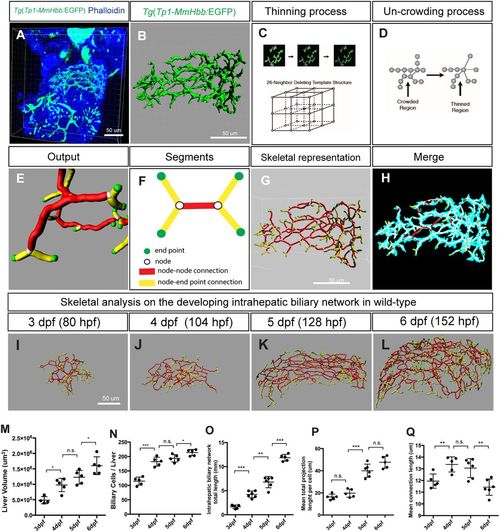
Skeletal analysis algorithm to quantify 3D branching patterns. (A) Projected confocal image of a Tg(Tp1-MmHbb:EGFP)um14 zebrafish liver visualized for EGFP and phalloidin expression at 4 dpf. (B) Segregated EGFP expression in the intrahepatic biliary network. (C) The thinning algorithm eliminates excess voxels from the surrounding 26 neighboring voxels until the network is presented by continuous single voxels. (D) The uncrowding algorithm eliminates congested areas, which are created by the thinning algorithm. (E) Graphical presentation of data generated from the skeletal analysis algorithm, which is the combination of the thinning and uncrowding algorithms. (F) Schematic representation of the skeletal analysis data. The complex 3D network is represented by a combination of four segments: end points, nodes, node-node connections, and node-end point connections. Each segment is given a unique identifier, and their location, length, shape, thickness and connectivity are defined. (G) Skeletal representation of the intrahepatic biliary network at 4 dpf generated by the skeletal analysis algorithm. (H) Merge of images in B and G. The original EGFP expression image and final skeletal representation match perfectly. (I-L) The skeletal analysis algorithm-based quantification of the developing intrahepatic biliary network. The skeletal representations of the intrahepatic biliary network were computed based on Tg(Tp1-MmHbb:EGFP)um14 expression in the wild-type liver at the indicated time points. (M) Average liver size (volume) of wild-type larvae. (N) Average number of Tg(Tp1-MmHbb:EGFP)um14-positive biliary epithelial cells in the liver. (O) The total length of the intrahepatic biliary network marked by Tg(Tp1-MmHbb:EGFP)um14 expression in the liver. (P) The total length of the intrahepatic biliary network divided by the number of biliary epithelial cells, indicating the mean projection length of the network per cell. (Q) Average length of connections in the liver. Error bars are s.d. *P<0.05, **P<0.01, ***P<0.001; n.s., not significant. EXPRESSION / LABELING:
|
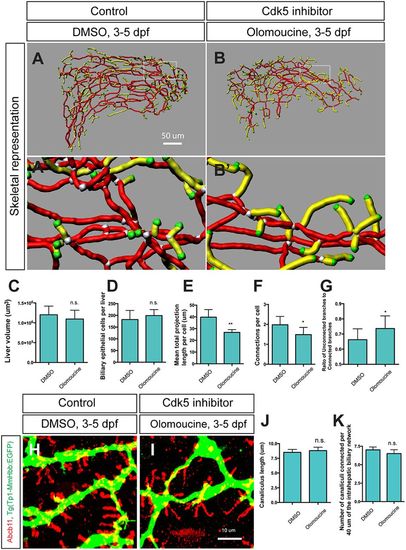
Cdk5 regulates intrahepatic biliary network formation. (A,B) Skeletal representation of the intrahepatic biliary network in Tg(Tp1-MmHbb:EGFP)um14 larvae treated from 3 to 5 dpf with DMSO (A) or the Cdk5 inhibitor olomoucine (B) computed based on Tg(Tp1-MmHbb:EGFP)um14 expression at 5 dpf. Boxed regions in A and B are magnified in A′ and B′. Nodes, end points, connected (node-node) and unconnected (node-end point) branches are colored as in Fig. 1F. (C-G) Measurements of intrahepatic biliary network structures by the skeletal analysis algorithm of the DMSO-treated and olomoucine-treated Tg(Tp1-MmHbb:EGFP)um14 larvae at 5 dpf. (C) Mean liver volume at 5 dpf. Liver volume was not affected by olomoucine treatment. (D) Average number of Tg(Tp1-MmHbb:EGFP)um14-positive biliary epithelial cells in the liver at 5 dpf. (E) Mean total projection length of the intrahepatic biliary network normalized to biliary epithelial cell number. (F) Number of connected branches normalized to biliary epithelial cell number. (G) Ratio of connected to unconnected branches. n=5 for all measurements. (H,I) Projected images of confocal z-stacks of the liver in DMSO-treated (H) or olomoucine-treated (I) larvae visualized for the bile canaliculus marker Abcb11 (red) and Tg(Tp1-MmHbb:EGFP)um14 (green) expression at 5 dpf. (J) Average length of canaliculus measured based on Abcb11 expression. In total, 135 canaliculi were analyzed. (K) The number of canaliculi connected per 40 μm of the Tg(Tp1-MmHbb:EGFP)um14-expressing intrahepatic biliary network (n=10 for each condition). Error bars are s.d. *P<0.05, **P<0.01; n.s., not significant. |
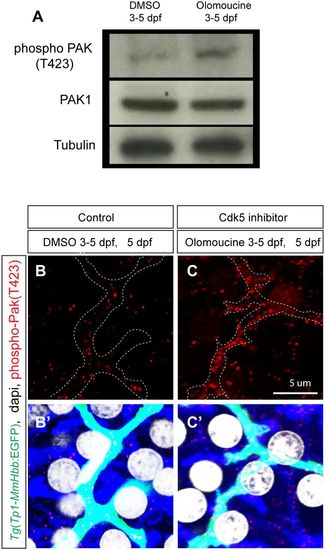
Cdk5 regulates Pak1 activity in biliary epithelial cells. (A) Pak1 phosphorylation (T423) levels in control DMSO-treated and olomoucine-treated wild-type Tg(Tp1-MmHbb:EGFP)um14 larvae were analyzed by western blotting at 5 dpf. Phospho-Pak1 was increased in olomoucine-treated larvae, whereas total Pak1 protein levels remained constant. Tubulin served as a loading control. These experiments were repeated three times with similar results. (B,C) Projected images of 4 μm-thick confocal z-stacks of the liver in DMSO-treated (B) or olomoucine-treated (C) larvae visualized for phospho-Pak1 (T423) (red). Biliary epithelial cells are outlined. (B′,C′) Phospho-Pak1 visualization merged with Tg(Tp1-MmHbb:EGFP)um14 expression (green), DAPI staining (white) and F-actin (phalloidin, blue). Pak1 is predominantly activated in Tg(Tp1-MmHbb:EGFP)um14-positive biliary epithelial cells in the liver of olomoucine-treated larvae. |

The Cdk5-Pak1-LimK-Cofilin kinase cascade regulates biliary system formation. (A-E) Skeletal representations of the intrahepatic biliary network in 5 dpf wild-type Tg(Tp1-MmHbb:EGFP)um14 larvae treated from 3 to 5 dpf with DMSO (A), olomoucine (B), IPA-3 (C), LimKi (D) or cucurbitacin E (E). (A′-E′) Density heat maps of the skeletal representations, in which segments with higher density [≥350 arbitrary units (au)] and lower density (<350 au) are colored red and blue, respectively. (F-I) Measurements of intrahepatic biliary network structures by the skeletal analysis algorithm of larvae treated as in A-E. (F) Percentage of segments showing high density (>350 au), which was calculated by the density analysis algorithm, as quantified from the density heat maps shown in A′-E′. (G) Mean segment density calculated by the density analysis algorithm. (H) Number of connected branches per biliary epithelial cell in the liver at 5 dpf. (I) Mean biliary epithelial cell number per liver. Error bars are s.d. n=5 for each treatment. *P<0.05, **P<0.01; n.s., not significant. |
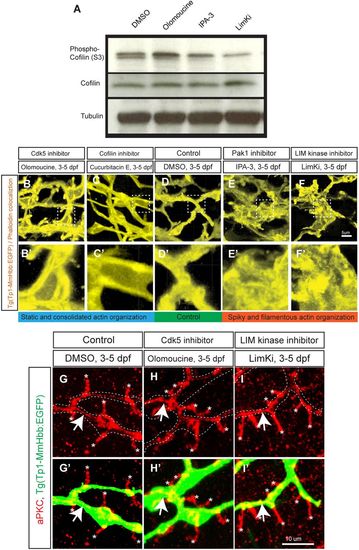
The Cdk5-mediated kinase cascade regulates F-actin cytoskeletal organization. (A) Cofilin phosphorylation levels at serine 3 (S3) in wild-type larvae treated with DMSO, olomoucine, IPA-3 or LimKi and analyzed by western blotting. Olomoucine treatment increased Cofilin S3 phosphorylation, thus inhibiting its activity. IPA-3 and LimKi treatment suppressed Cofilin S3 phosphorylation, activating its activity. Total Cofilin protein levels remained constant. Tubulin blotting provided a loading control. These experiments were repeated three times with similar results. (B-F) Projected colocalization signal images computed based on Tg(Tp1-MmHbb:EGFP)um14 expression and phalloidin to visualize the actin network in biliary epithelial cells at 5 dpf in larvae treated as indicated. Compared with the control, F-actin appeared to be localized around the lumen in olomoucine-treated and cucurbitacin E-treated larvae, whereas it showed spiky and filamentous organization in IPA-3-treated and LimKi-treated larvae. Boxed regions in B-F are magnified in B′-F′. (G-I) Projected images of 15 μm-thick confocal z-stacks of the liver in larvae treated as indicated and visualized for apical membrane marker aPKC (red) expression at 5 dpf. (G′-I′) aPKC expression merged with Tg(Tp1-MmHbb:EGFP)um14 (green) expression. At 5 dpf, aPKC showed restricted expression in bile canaliculi (asterisks), which are the apical membranes of hepatocytes, and in the apical membranes of biliary epithelial cells (arrows) in control larvae. This expression was unchanged by olomoucine or LimKi treatment. These data suggest that Cdk5 or LimK inhibitors do not influence the apicobasal polarization of biliary epithelial cells. |
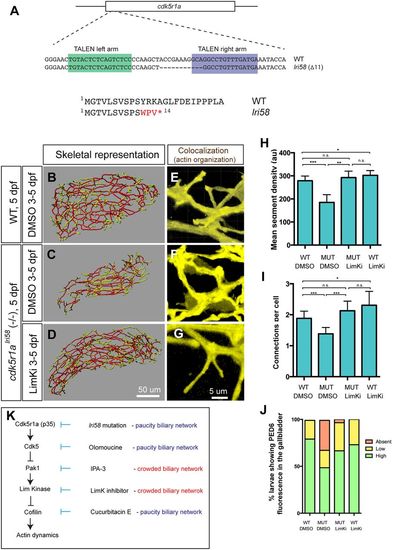
cdk5r1a (p35) mutant larvae show intrahepatic biliary network defects, which are rescued by LimKi treatment. (A) The TALEN-based cdk5r1a knockout strategy. Sequence-specific TALENs were designed against the first exon of the cdk5r1a gene, which includes the entire ORF. We established the lri58 allele in which 11 bp were deleted from the cdk5r1a gene, truncating the Cdk5r1a protein at the fourteenth amino acid. (B-D) Skeletal representations of the intrahepatic biliary network in DMSO-treated wild-type (B) and in DMSO-treated (C) or LimKi-treated (D) cdk5r1alri58 mutant larvae computed based on Tg(Tp1-MmHbb:EGFP)um14 expression in the liver at 5 dpf. (E-G) Projected colocalization signal images computed based on Tg(Tp1-MmHbb:EGFP)um14 expression and phalloidin to visualize the actin network in biliary epithelial cells of larvae treated as in B-D. (H) Mean segment density in DMSO-treated or LimKi-treated wild-type or cdk5r1alri58 mutant larvae at 5 dpf. (I) Number of connected branches per biliary epithelial cell in the liver of DMSO-treated or LimKi-treated wild-type or cdk5r1alri58 mutant larvae at 5 dpf. n=5 for all experiments. Error bars are s.d. *P<0.05, **P<0.01, ***P<0.001; n.s., not significant. (J) Percentage of larvae showing high, low and no PED6 fluorescence in the gallbladder of DMSO-treated or LimKi-treated wild-type or cdk5r1alri58 mutant larvae at 5 dpf. (K) Model of the Cdk5-mediated kinase cascade that regulates branching morphogenesis of the intrahepatic biliary network. Cdk5r1a appears to be responsible for Cdk5 activation in biliary epithelial cells. Cdk5 suppresses Pak1 activity, and thus suppressing Cdk5 by olomoucine enhances Pak1 activity. Suppressing Pak1 activity by IPA-3 generated a biliary network phenotype opposite to that of cdk5r1a mutant and olomoucine-treated larvae. Pak1 appears to regulate LimKs, and thus suppressing LimK activity with LimKi generated a similar biliary network phenotype to that of larvae in which Pak1 activity is suppressed. LimKs suppress Cofilin activity by direct phosphorylation. Suppressing Cofilin by cucurbitacin E thus generated a biliary phenotype opposite to that of larvae in which Pak1 or LimK activity was suppressed. |
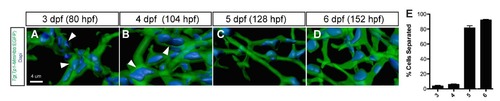
Biliary epithelial cell remodeling during intrahepatic biliary network formation in zebrafish. (A-D) Projected confocal image of a Tg(Tp1- MmHbb:EGFP)um14 liver visualized for GFP (green) and DAPI (pseudo-color blue) at 3 (A), 4 (B), 5 (C) and 6 (D) dpf. GFP marks the intrahepatic biliary network. Biliary epithelial cells form clusters (white arrowheads) within the intrahepatic biliary network in wild-type larvae at 3 and 4 dpf. However, these cells separate after 5 dpf. (E) The percentage of biliary epithelial cells that are not clustered with other biliary epithelial cells. |
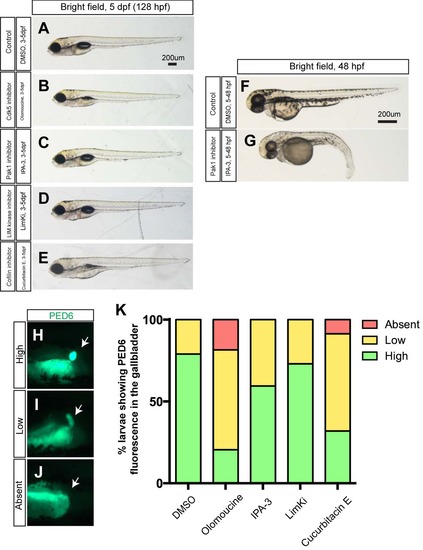
Larval physical appearance and PED-6 expression in small molecule inhibitor treated larvae. (A-E) Bright field images of control DMSO- (A), olomoucine- (B), IPA-3- (C), LimKi- (D) and cucurbitacin E- (E) treated larvae at 5 dpf. All small molecule inhibitors were treated from 3 to 5 dpf. Lateral views, anterior to the left. These small molecule inhibitors did not induce significant change in larval physical appearance at the concentrations used. Note that none of IPA3-treated larvae (C) showed blood circulation defects (n>50). (F-G) The same concentration of IPA-3 (1uM) treatment from 5 to 48 hours induced a phenotype that is indistinguishable from that of Pak1 moprholino injected embryos (Kelly et al., 2014). As seen in Pak1 morpholino injected embryos, these IPA-3-treated embryos did not have blood circulation (n = 9 out of 11). These data suggest that IPA-3 is inhibiting Pak1 function, and Pak1 is dispensable from proper cardiac morphogenesis after 3 pdf. (H-J) Fluorescent images of DMSO- and olomoucine-treated wild-type larvae soaked in PED6. PED6 is processed by phospholipase and fluorescence was detected in the intestine in all treated larvae. However, in some olomoucine-treated larvae, PED6 fluorescence in the gallbladder became weaker (I) or absent (J), compared to strong fluorescence (H) in wild-type larvae. White arrows point to the gallbladder. (K) Percentage of larvae showing high, low and no PED6 fluorescence in the gallbladder of DMSO-, olomoucine-, IPA-3-, LimKi- and cucurbitacin E- treated wild-type larvae at 5 dpf. |
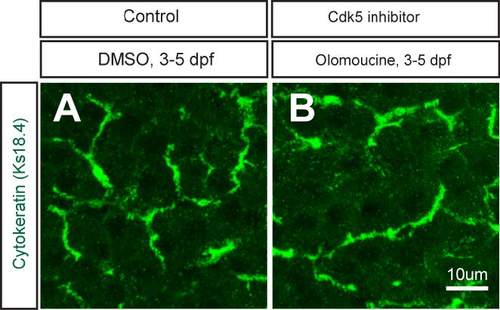
Cytokeratin staining with DMSO- and olomoucine-treated larvae. (A-B) Projected images of 5 um-thick confocal z-stacks of the liver in DMSO- (A) and olomoucine-treated (B) larvae visualized for Cytokeratin expression at 5 dpf. Cytokeratin is dominantly localized in the intrahepatic biliary network. There was no observable difference in Cytokeratin expression in olomoucine-treated larvae. |
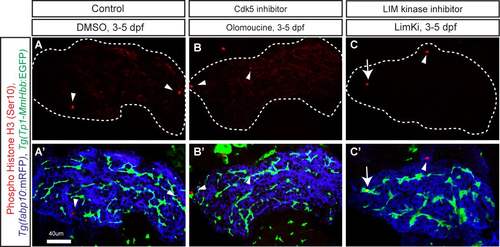
Cell proliferation measurement in olomoucine- and LIM kinase inhibitor- treated larvae. (A-C) Z-plane confocal images of the liver at 5dpf of DMSO- (A), olomoucine- (B) and LimKi-treated (C) larvae visualized for phospho-Histone H3 (pseudocolored red) expression. White dotted lines outline the liver. Phospho-Histone H3 expression was merged with Tg(Tp1-MmHbb:EGFP)um14 (Green) and Tg(fabp10:mRFP)lri2 (pseudo-colored blue) expression and shown separately in A'-C'. Arrowheads point to Phospho-Histone H3 expression in Tg(fabp10:mRFP)lri2 positive hepatocytes. Arrow points to Phospho-Histone H3 expression in Tg(Tp1-MmHbb:EGFP)um14 positive biliary epithelial cells. In the LimKi-treated liver, the number of Phospho-Histone H3 and Tg(Tp1- MmHbb:EGFP)um14 double positive cells (average 3.75 cells per liver, n=4, SD =0.9, p<0.05) increased compared to that of the DMSO-treated liver (average 1.3 cells per liver, n = 4, SD = 1.3), while in the olomoucine-treated liver, the number of double positive cells (average 1.0 cells per liver, n = 5, SD = 0.7) did not change. These data suggest that Tg(Tp1- MmHbb:EGFP)um14 positive biliary epithelial cells appeared to proliferate more in LimKitreated larvae. |
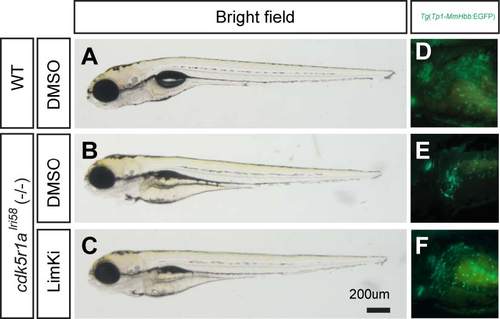
Larval physical appearance of cdk5r1alri58 mutant larvae. (AC) Bright field images of DMSO-treated wild-type (A) and DMSO- (B) or LimKi-treated (C) cdk5r1alri58 mutant larvae at 5 dpf. (D-F) Fluorescent image of DMSO-treated wild-type (D) and DMSO- (E) or LimKi-treated (F) cdk5r1alri58 mutant Tg(Tp1-MmHbb:EGFP)um14 larvae at 5 dpf. |
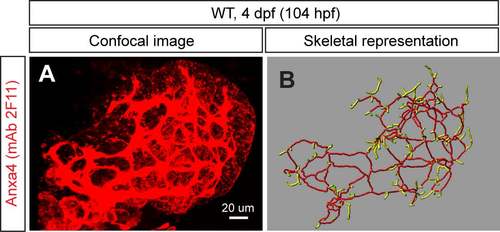
The skeletal analysis worked with the anti-Anxa4 (mAb 2F11) staining data. (A) Projected confocal image of the wild-type liver visualized for Anxa4 expression by mAb 2F11 staining at 104 hpf. (B) Skeletal representations of the intrahepatic biliary network computed based on Anxa4 expression in (A). The liver analysis program developed in this study can analyze the anti-Anxa4 staining data. Ventral views, anterior to the top. |