
IMAGE
Fig. S1
- ID
- ZDB-IMAGE-170816-7
- Publication
- Dimri et al., 2017 - Three-dimensional structural analysis reveals a Cdk5-mediated kinase cascade regulating hepatic biliary network branching in zebrafish
- All Figures
- Figures for Dimri et al., 2017
Image
|
Figure Caption
Fig. S1
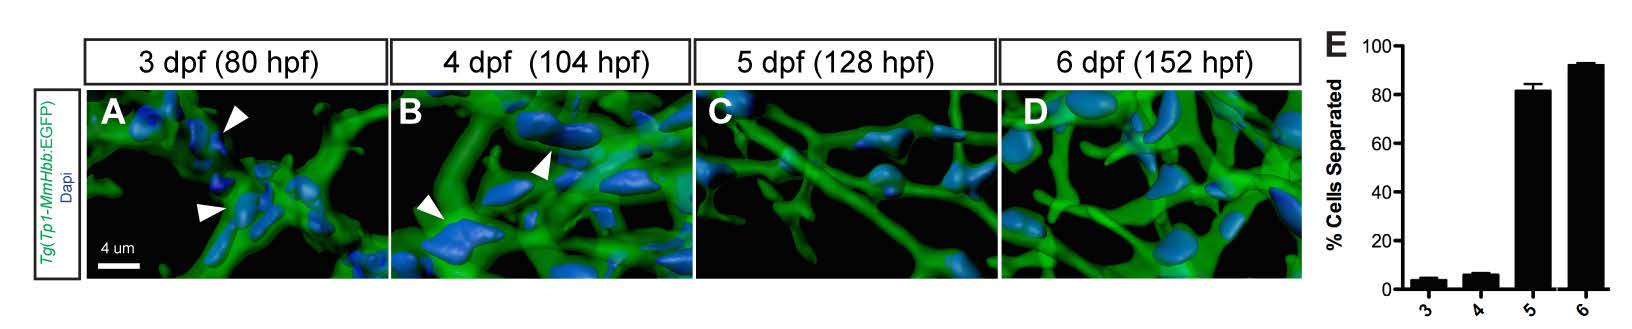
Biliary epithelial cell remodeling during intrahepatic biliary network formation in zebrafish. (A-D) Projected confocal image of a Tg(Tp1- MmHbb:EGFP)um14 liver visualized for GFP (green) and DAPI (pseudo-color blue) at 3 (A), 4 (B), 5 (C) and 6 (D) dpf. GFP marks the intrahepatic biliary network. Biliary epithelial cells form clusters (white arrowheads) within the intrahepatic biliary network in wild-type larvae at 3 and 4 dpf. However, these cells separate after 5 dpf. (E) The percentage of biliary epithelial cells that are not clustered with other biliary epithelial cells.
Acknowledgments
This image is the copyrighted work of the attributed author or publisher, and
ZFIN has permission only to display this image to its users.
Additional permissions should be obtained from the applicable author or publisher of the image.
Full text @ Development