
Fig. S4
- ID
- ZDB-FIG-170816-10
- Publication
- Dimri et al., 2017 - Three-dimensional structural analysis reveals a Cdk5-mediated kinase cascade regulating hepatic biliary network branching in zebrafish
- Other Figures
- All Figure Page
- Back to All Figure Page
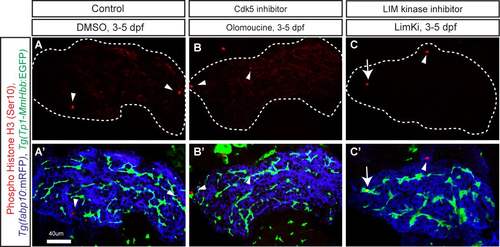
Cell proliferation measurement in olomoucine- and LIM kinase inhibitor- treated larvae. (A-C) Z-plane confocal images of the liver at 5dpf of DMSO- (A), olomoucine- (B) and LimKi-treated (C) larvae visualized for phospho-Histone H3 (pseudocolored red) expression. White dotted lines outline the liver. Phospho-Histone H3 expression was merged with Tg(Tp1-MmHbb:EGFP)um14 (Green) and Tg(fabp10:mRFP)lri2 (pseudo-colored blue) expression and shown separately in A'-C'. Arrowheads point to Phospho-Histone H3 expression in Tg(fabp10:mRFP)lri2 positive hepatocytes. Arrow points to Phospho-Histone H3 expression in Tg(Tp1-MmHbb:EGFP)um14 positive biliary epithelial cells. In the LimKi-treated liver, the number of Phospho-Histone H3 and Tg(Tp1- MmHbb:EGFP)um14 double positive cells (average 3.75 cells per liver, n=4, SD =0.9, p<0.05) increased compared to that of the DMSO-treated liver (average 1.3 cells per liver, n = 4, SD = 1.3), while in the olomoucine-treated liver, the number of double positive cells (average 1.0 cells per liver, n = 5, SD = 0.7) did not change. These data suggest that Tg(Tp1- MmHbb:EGFP)um14 positive biliary epithelial cells appeared to proliferate more in LimKitreated larvae. |