
Fig. 1
- ID
- ZDB-FIG-170816-1
- Publication
- Dimri et al., 2017 - Three-dimensional structural analysis reveals a Cdk5-mediated kinase cascade regulating hepatic biliary network branching in zebrafish
- Other Figures
- All Figure Page
- Back to All Figure Page
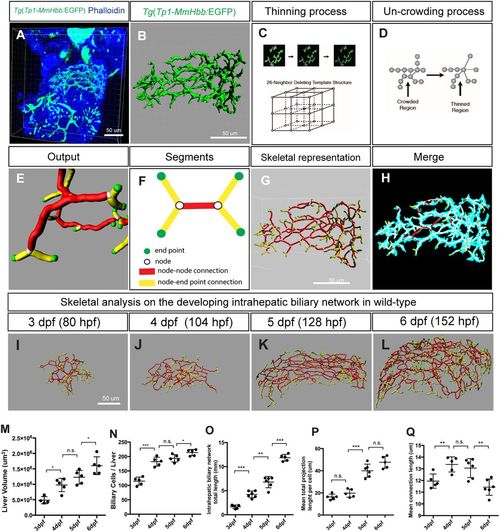
Skeletal analysis algorithm to quantify 3D branching patterns. (A) Projected confocal image of a Tg(Tp1-MmHbb:EGFP)um14 zebrafish liver visualized for EGFP and phalloidin expression at 4 dpf. (B) Segregated EGFP expression in the intrahepatic biliary network. (C) The thinning algorithm eliminates excess voxels from the surrounding 26 neighboring voxels until the network is presented by continuous single voxels. (D) The uncrowding algorithm eliminates congested areas, which are created by the thinning algorithm. (E) Graphical presentation of data generated from the skeletal analysis algorithm, which is the combination of the thinning and uncrowding algorithms. (F) Schematic representation of the skeletal analysis data. The complex 3D network is represented by a combination of four segments: end points, nodes, node-node connections, and node-end point connections. Each segment is given a unique identifier, and their location, length, shape, thickness and connectivity are defined. (G) Skeletal representation of the intrahepatic biliary network at 4 dpf generated by the skeletal analysis algorithm. (H) Merge of images in B and G. The original EGFP expression image and final skeletal representation match perfectly. (I-L) The skeletal analysis algorithm-based quantification of the developing intrahepatic biliary network. The skeletal representations of the intrahepatic biliary network were computed based on Tg(Tp1-MmHbb:EGFP)um14 expression in the wild-type liver at the indicated time points. (M) Average liver size (volume) of wild-type larvae. (N) Average number of Tg(Tp1-MmHbb:EGFP)um14-positive biliary epithelial cells in the liver. (O) The total length of the intrahepatic biliary network marked by Tg(Tp1-MmHbb:EGFP)um14 expression in the liver. (P) The total length of the intrahepatic biliary network divided by the number of biliary epithelial cells, indicating the mean projection length of the network per cell. (Q) Average length of connections in the liver. Error bars are s.d. *P<0.05, **P<0.01, ***P<0.001; n.s., not significant. |
| Gene: | |
|---|---|
| Fish: | |
| Anatomical Term: | |
| Stage Range: | Protruding-mouth to Day 6 |