
IMAGE
Fig. S3
- ID
- ZDB-IMAGE-170816-9
- Publication
- Dimri et al., 2017 - Three-dimensional structural analysis reveals a Cdk5-mediated kinase cascade regulating hepatic biliary network branching in zebrafish
- All Figures
- Figures for Dimri et al., 2017
Image
|
Figure Caption
Fig. S3
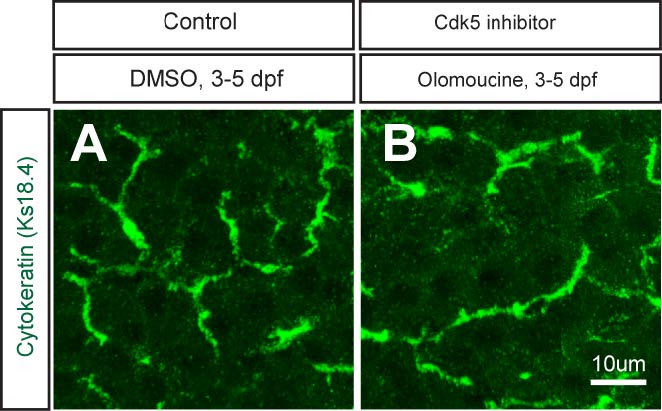
Cytokeratin staining with DMSO- and olomoucine-treated larvae. (A-B) Projected images of 5 um-thick confocal z-stacks of the liver in DMSO- (A) and olomoucine-treated (B) larvae visualized for Cytokeratin expression at 5 dpf. Cytokeratin is dominantly localized in the intrahepatic biliary network. There was no observable difference in Cytokeratin expression in olomoucine-treated larvae.
Acknowledgments
This image is the copyrighted work of the attributed author or publisher, and
ZFIN has permission only to display this image to its users.
Additional permissions should be obtained from the applicable author or publisher of the image.
Full text @ Development