
- Title
-
Chytrid fungus infection in zebrafish demonstrates that the pathogen can parasitize non-amphibian vertebrate hosts
- Authors
- Liew, N., Mazon Moya, M.J., Wierzbicki, C.J., Hollinshead, M., Dillon, M.J., Thornton, C.R., Ellison, A., Cable, J., Fisher, M.C., Mostowy, S.
- Source
- Full text @ Nat. Commun.
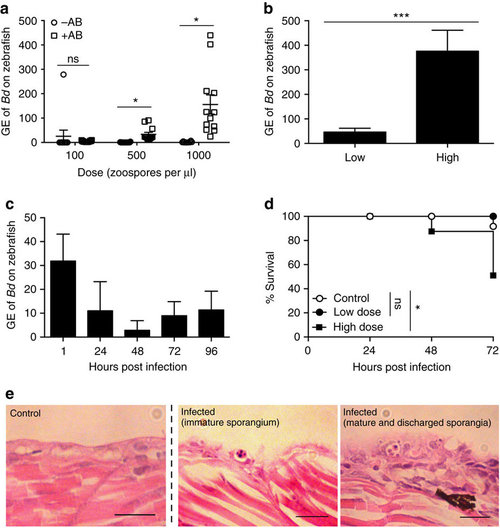
Bd infection of zebrafish larvae. (a) Zebrafish larvae bath water without (−AB, open circles) or with (+AB, open squares) 1% penicillin/streptomycin was inoculated with three doses of Bd zoospores. Bath water changed at 24 h post infection (h.p.i.) and larvae incubated for 72 h.p.i. Zebrafish DNA was extracted and amplified by qPCR. Data from 1 experiment shown, using n=12 per treatment. Mean±s.e.m. are shown. Significance testing performed using unpaired Student’s t-test (two tailed), ns P>0.05, *P<0.05. See Supplementary Fig. 1b for replicate experiments. (b) Zebrafish larvae bath water was inoculated with low (<200 zsp per μl) or high (>200 zsp per μl) dose Bd zoospores and incubated for 72 h.p.i. Zebrafish DNA was extracted and amplified by qPCR. Data from two experiments plotted here, using n=12 per treatment. Mean±s.e.m. are shown. Significance testing performed using unpaired Student’s t-test (two tailed), ***P<0.001. See Supplementary Fig. 1c for replicate experiments. (c) Zebrafish larvae bath water was inoculated with low dose Bd zoospores and incubated for 1, 24, 48, 72 or 96 h.p.i. Zebrafish DNA was extracted as in a; Data from one experiment are plotted here (dose=80 zsp per μl), using n=3 per time point. Mean±s.e.m. are shown. See Supplementary Fig. 1d for replicate experiments. (d) Survival curve of zebrafish larvae bath water inoculated with mTGhL (control, open circles, n=420), low (filled circles, n=84) or high (filled squares, n=336) dose Bd zoospores. Larvae were incubated for 72 h.p.i. Data pooled from twenty-five experiments. Mean±s.e.m. are shown. Significance testing performed by Mantel–Cox (log-rank) test. ns P>0.05, *P<0.05. See Supplementary Table 1 for replicate experiments. (e) Zebrafish larvae bath water was inoculated with control or high dose Bd zoospores and incubated for 72 h.p.i. Representative longitudinal histological sections shown here. 1, encysted zoosporangium; 2, mature sporangium with internal zoospores; 3, empty zoosporangium with discharge tube protruding out of epithelial cells exhibiting extensive hyperplasia. Scale bars, 20 μm. GE, genomic equivalents. |
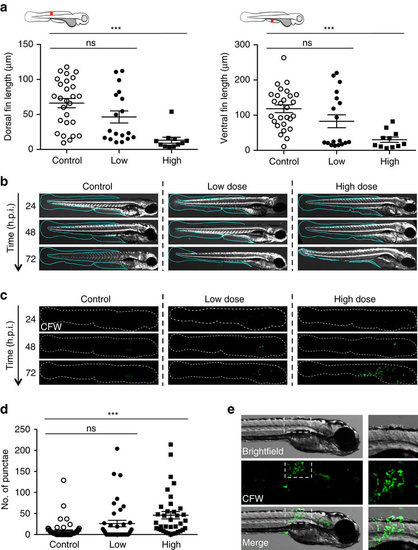
Symptoms of Bd infection in zebrafish larvae. (a) Zebrafish larvae bath water was inoculated with mTGhL plate washings (control, open circles), low (<200 zsp per μl, filled circles) or high (>200 zsp per μl, filled squares) dose Bd zoospores. Larvae were incubated for 72 h.p.i., where dorsal and ventral fin length was measured (as depicted by red line in cartoon above each graph). Each point represents an individual larva. Data pooled from three experiments per dose, using n=4–12 per treatment. Mean±s.e.m. are shown. Significance testing performed using unpaired Student’s t-test (two-tailed), ns P>0.05, ***P<0.001. (b) Zebrafish larvae bath water was inoculated with control, low or high dose Bd zoospores, incubated for 72 h.p.i. and imaged by stereomicroscopy. Representative images with cyan outline showing presence or erosion of fin over time. (c) Zebrafish larvae bath water was inoculated with control, low or high dose Bd zoospores and incubated for 24, 48 or 72 h.p.i., then labelled with calcofluor white (CFW; for chitin, green) and imaged by fluorescent stereomicroscopy. Representative images with dotted outline of larvae showing (CFW)-labelled punctae on infected larvae. (d) Enumeration of CFW-labelled punctae from zebrafish larvae whose bath water was inoculated with control (open circles), low (filled circles) or high (filled squares) dose Bd zoospores and incubated for 72 h.p.i. Each point represents an individual larva. Data pooled from three experiments per dose, using n=12 per treatment. Mean±s.e.m. are shown. Significance testing performed using Mann–Whitney test (two tailed), ns P>0.05, ***P<0.001. See also Supplementary Fig. 2e for replicate experiments. (e) Zebrafish larvae bath water was inoculated with high dose Bd zoospores and incubated for 72 h.p.i., then labelled with CFW (green) and imaged by fluorescent stereomicroscopy. Representative images with insets showing colocalization of CFW-labelled punctae with blisters. |
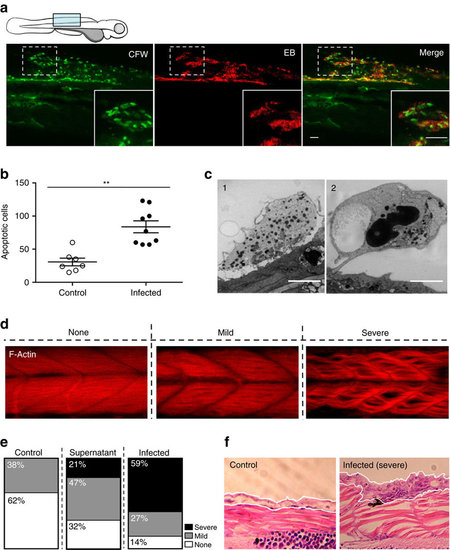
Consequence of Bd infection on zebrafish larvae host tissue. (a) Zebrafish larvae bath water was inoculated with low (<200 zsp per μl) dose Bd zoospores and incubated for 72 h.p.i., then labelled with calcoluor white (CFW; for chitin, green) and evans blue (EB; for tissue damage, red), and visualized by confocal microscopy. Images taken at × 40, maximum intensity projection of Z-stack shown here. Cartoon depicts imaged region. Representative images with insets highlight colocalization of CFW-labelled punctae with EB positive tissue damage. Scale bars, 50 μm. See also Supplementary Fig. 3a for more examples. (b) Enumeration of apoptotic cells from larvae whose bath water was inoculated with mTGhL plate washings (control, open circles) or low (filled circles) dose Bd zoospores and incubated for 72 h.p.i., then fixed and labelled with TUNEL. Each point represents an individual larva. Data pooled from three experiments, using n=3 per treatment. Mean±s.e.m. are shown. Significance testing performed using Mann–Whitney test (two tailed), **P<0.01. (c) Zebrafish larvae bath water was inoculated with high dose Bd zoospores and incubated for 72 h.p.i., then fixed for electron microscopy (EM). 1, Sloughing necrotic cell. 2, sloughed necrotic cell. Scale bars, 1 μm. See also Supplementary Fig. 3d for EM images of larvae treated with control. (d) Zebrafish larvae bath water was inoculated with control, high (>200 zsp per μl) dose Bd zoospore supernatant or high dose Bd zoospores and incubated for 72 h.p.i., then fixed, labelled with phalloidin (for F-Actin; red) and visualized by confocal microscopy. Images taken at 40X, maximum intensity projection of Z-stack shown here. Representative images of larva with no, mild or severe muscle degeneration are shown here. (e) Proportion of larvae with no (white), mild (grey) or severe (black) muscle degeneration when prepared as in d. (f) Zebrafish larvae bath water was inoculated with control or high dose Bd zoospores and incubated for 72 h.p.i. Representative longitudinal histological sections shown here. White outline highlights skin of larvae, which in infected image shows hyperplasia of epithelial cells with mature and discharged sporangia. |
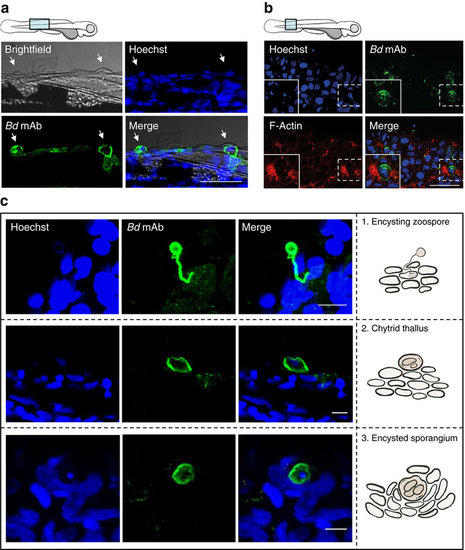
Intracellular colonization by Bd in zebrafish larvae. (a) Zebrafish larvae bath water was inoculated with high (>200 zsp per μl) dose Bd zoospores and incubated for 72 h.p.i., then fixed and labelled with Hoechst (for DNA; blue) and mAb 5C4 (for Bd; green) for visualization by confocal microscopy. Images taken at 63 X, maximum intensity projection of Z-stack shown here. Cartoon depicts imaged region. Representative images with arrows highlight colocalization between Bd and blisters on larvae skin. Scale bar, 50 μm. (b) Zebrafish larvae bath water was inoculated with high dose Bd zoospores and incubated for 72 h.p.i., then fixed and labelled with Hoechst (for DNA; blue), mAb 5C4 (for Bd; green) and phalloidin (for F-Actin; red) for visualization by confocal microscopy. Images taken at × 63, maximum intensity projection of Z-stack shown here. Cartoon depicts imaged region. Representative images with insets highlight Bd adjacent to host cell actin rearrangements. Scale bar, 50 μm. See also Supplementary Fig. 4c for host cell actin in control treated larvae. (c) Zebrafish larvae bath water was treated as in a. Images taken at × 40 or × 63, maximum intensity projection of Z-stack shown here. Images showing different stages of Bd invasion and infection on larvae, also depicted using cartoons in the right column. 1, rhizoid-like germ tube attached to encysting zoospore, 2, chytrid thallus growth on zebrafish larvae skin, 3, encysted sporangium amongst hyperplasic epithelial cells. Scale bars, 10 μm. |
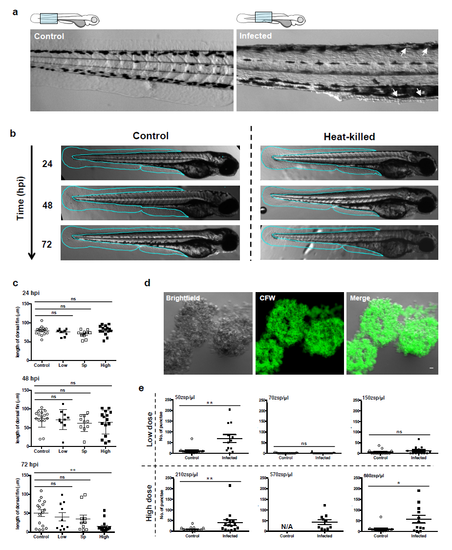
Symptoms of Bd infection in zebrafish larvae (Related to Figure 2). (a) Zebrafish larvae bath water was inoculated with mTGhL (control) or high (> 200 zsp/μl) dose Bd zoospores, incubated for 72 hpi and imaged by stereomicroscopy. Cartoon depicts imaged region. Representative images with arrows highlighting 25 blisters on infected larva. (b) Zebrafish larvae bath water was inoculated with heat killed or high dose Bd zoospores, incubated for 72 hpi and imaged by stereomicroscopy. Representative images with cyan outline showing presence of fin over time. (c) Zebrafish larvae bath water was inoculated with control (open circles), low dose Bd zoospores ( < 200 zsp/μl, filled circles) high dose Bd supernatant (open squares) or high dose Bd zoospores (filled squares). Larvae were incubated for 72 hpi and dorsal fin length was measured at 24, 48 and 72 hpi. Each point represents fin length on an individual larva. Data pooled from three experiments per dose, using n = 3 – 4 per treatment. Mean ± SEM are shown. Significance testing performed using unpaired student’s t-test (two-tailed), ns p > 0.05, *** p < 0.001. (d) Bd broth culture was labelled with calcofluor white (CFW; for chitin, green) using the same protocol as in zebrafish larvae and imaged by fluorescent stereomicroscopy. Representative images showing colocalisation of CFW with Bd sporangium. Scale bar = 50 μm. (e) Enumeration of CFW-labelled punctae from larvae whose bath water was inoculated with control (open circles), low (filled circles) or high (filled squares) dose Bd zoospores and incubated for 72 hpi. Each point represents an individual larva, using n = 12 per treatment. Mean ± SEM are shown. Showing replicate experiments used in Fig. 2d. Significance testing performed using Mann-Whitney test (two-tailed), ns p > 0.05, * p < 0.05, ** p < 0.01. |
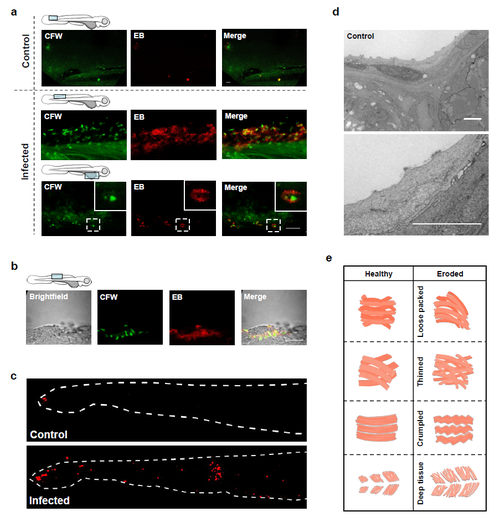
Consequence of Bd infection on zebrafish 44 larvae host tissue (Related to Figure 3). (a) Zebrafish larvae bath water was inoculated with with mTGhL plate washings (control) or low (< 200 zsp/μl) dose Bd zoospores and incubated for 72 hpi, then labelled with calcoluor white (CFW; for chitin, green) and evans blue (EB; for tissue damage, red), and visualised by confocal microscopy. Images taken at 63X, maximum intensity projection of Z-stack shown here. Cartoon depicts imaged region. Representative images with insets highlight colocalisation of CFW-labelled punctae with EB positive tissue damage. Scale bars = 50 μm. (b) Zebrafish larvae bath water was inoculated with high (> 200 zsp/μl) dose Bd zoospores, then labelled and imaged as in (a). Scale bar = 50 μm. (c) Zebrafish larvae bath water was inoculated with mTGhL (control) or low dose Bd zoospores and incubated for 72 hpi, then fixed, labelled with TUNEL (for apoptotic cells; red) and imaged by fluorescent stereomicroscopy. Representative images with dotted outline of larvae tail fin showing an increase in apoptotic cells on infected larvae. (d) Zebrafish larvae bath water was inoculated with control and incubated for 72 hpi, then fixed for electron microscopy (EM). Images show healthy larvae skin. (e) Diagram showing phenotypes used to categorise severity of muscle degeneration in zebrafish larvae. Left column shows cartoons to illustrate the appearance of healthy muscle; right column shows cartoons for eroded muscle, including loose packing, thinning, crumpling and deep tissue degeneration of muscle fibres. |
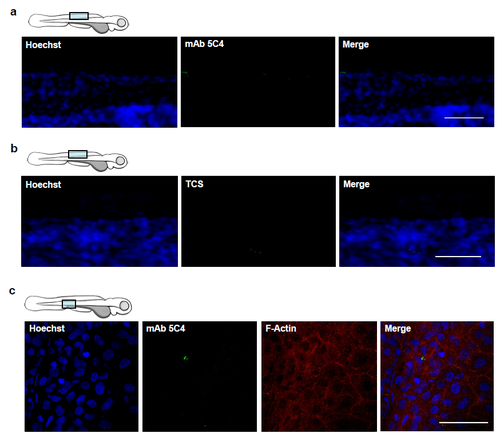
Intracellular colonization by Bd in zebrafish 63 larvae (Related to Figure 4). (a) Zebrafish larvae bath water was inoculated with mTGhL (control) and incubated for 72 hpi, then fixed and labelled for Hoechst (for DNA; blue) and mAb 5C4 (for Bd; green) for visualisation by confocal microscopy. Images taken at 40X, maximum intensity projection of Z-stack shown here. Representative images highlight minimal background labelling of mAb 5C4 in control larvae. Scale bar = 50 μm. (b) Zebrafish larvae bath water was inoculated with high (> 200 zsp/μl) dose Bd zoospores and incubated for 72 hpi, then fixed and labelled for Hoechst (for DNA; blue) and tissue culture supernatant (TCS; i.e. mAb 5C4 suspension medium) for visualisation by confocal microscopy. Images taken at 63X, maximum intensity projection of Z-stack shown here. Representative images highlight minimal background labelling of TCS in infected larvae. Scale bar = 50 μm. (c) Zebrafish larvae bath water was inoculated with control and incubated for 72 hpi, then fixed and labelled with Hoechst (for DNA; blue), mAb 5C4 (for Bd; green) and phalloidin (for F-Actin; red) for visualisation by confocal microscopy. Images taken at 63X, maximum intensity projection of Z-stack shown here. Cartoon depicts imaged region. Representative images show distribution of F-actin in healthy larvae. Scale bar = 50 μm. |