
|
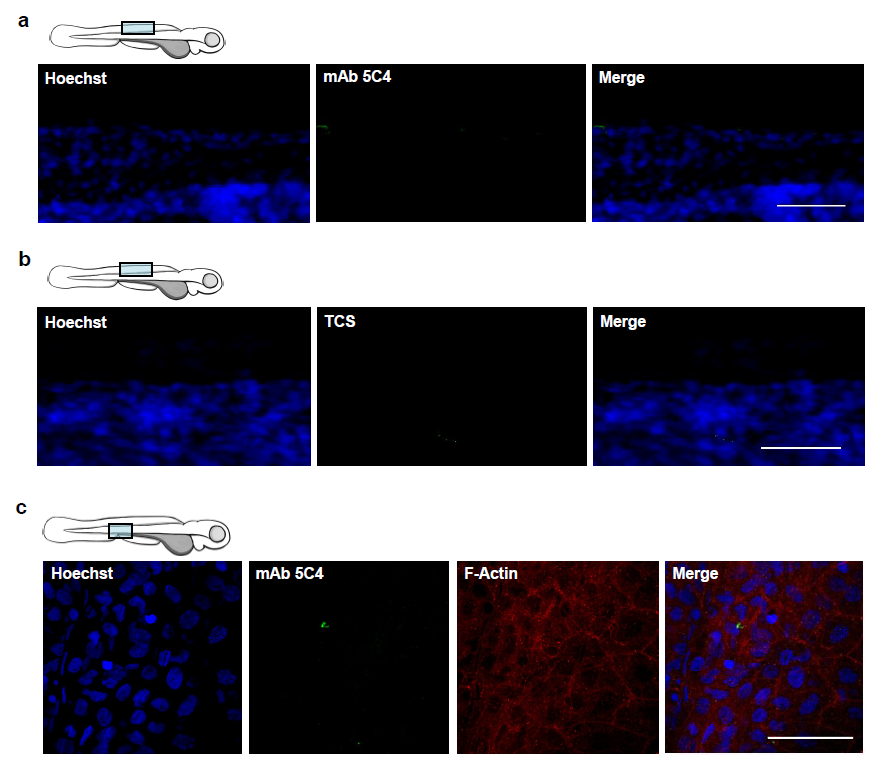
Fig. S4
Intracellular colonization by Bd in zebrafish 63 larvae (Related to Figure 4).
(a) Zebrafish larvae bath water was inoculated with mTGhL (control) and incubated for 72 hpi, then fixed and labelled for Hoechst (for DNA; blue) and mAb 5C4 (for Bd; green) for visualisation by confocal microscopy. Images taken at 40X, maximum intensity projection of Z-stack shown here. Representative images highlight minimal background labelling of mAb 5C4 in control larvae. Scale bar = 50 μm. (b) Zebrafish larvae bath water was inoculated with high (> 200 zsp/μl) dose Bd zoospores and incubated for 72 hpi, then fixed and labelled for Hoechst (for DNA; blue) and tissue culture supernatant (TCS; i.e. mAb 5C4 suspension medium) for visualisation by confocal microscopy. Images taken at 63X, maximum intensity projection of Z-stack shown here. Representative images highlight minimal background labelling of TCS in infected larvae. Scale bar = 50 μm. (c) Zebrafish larvae bath water was inoculated with control and incubated for 72 hpi, then fixed and labelled with Hoechst (for DNA; blue), mAb 5C4 (for Bd; green) and phalloidin (for F-Actin; red) for visualisation by confocal microscopy. Images taken at 63X, maximum intensity projection of Z-stack shown here. Cartoon depicts imaged region. Representative images show distribution of F-actin in healthy larvae. Scale bar = 50 μm.