
Fig. 1
- ID
- ZDB-FIG-170525-9
- Publication
- Liew et al., 2017 - Chytrid fungus infection in zebrafish demonstrates that the pathogen can parasitize non-amphibian vertebrate hosts
- Other Figures
- All Figure Page
- Back to All Figure Page
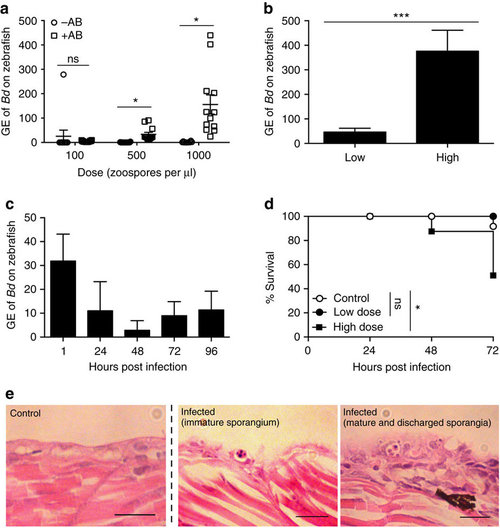
Bd infection of zebrafish larvae. (a) Zebrafish larvae bath water without (−AB, open circles) or with (+AB, open squares) 1% penicillin/streptomycin was inoculated with three doses of Bd zoospores. Bath water changed at 24 h post infection (h.p.i.) and larvae incubated for 72 h.p.i. Zebrafish DNA was extracted and amplified by qPCR. Data from 1 experiment shown, using n=12 per treatment. Mean±s.e.m. are shown. Significance testing performed using unpaired Student’s t-test (two tailed), ns P>0.05, *P<0.05. See Supplementary Fig. 1b for replicate experiments. (b) Zebrafish larvae bath water was inoculated with low (<200 zsp per μl) or high (>200 zsp per μl) dose Bd zoospores and incubated for 72 h.p.i. Zebrafish DNA was extracted and amplified by qPCR. Data from two experiments plotted here, using n=12 per treatment. Mean±s.e.m. are shown. Significance testing performed using unpaired Student’s t-test (two tailed), ***P<0.001. See Supplementary Fig. 1c for replicate experiments. (c) Zebrafish larvae bath water was inoculated with low dose Bd zoospores and incubated for 1, 24, 48, 72 or 96 h.p.i. Zebrafish DNA was extracted as in a; Data from one experiment are plotted here (dose=80 zsp per μl), using n=3 per time point. Mean±s.e.m. are shown. See Supplementary Fig. 1d for replicate experiments. (d) Survival curve of zebrafish larvae bath water inoculated with mTGhL (control, open circles, n=420), low (filled circles, n=84) or high (filled squares, n=336) dose Bd zoospores. Larvae were incubated for 72 h.p.i. Data pooled from twenty-five experiments. Mean±s.e.m. are shown. Significance testing performed by Mantel–Cox (log-rank) test. ns P>0.05, *P<0.05. See Supplementary Table 1 for replicate experiments. (e) Zebrafish larvae bath water was inoculated with control or high dose Bd zoospores and incubated for 72 h.p.i. Representative longitudinal histological sections shown here. 1, encysted zoosporangium; 2, mature sporangium with internal zoospores; 3, empty zoosporangium with discharge tube protruding out of epithelial cells exhibiting extensive hyperplasia. Scale bars, 20 μm. GE, genomic equivalents. |