
|
Fig. 3
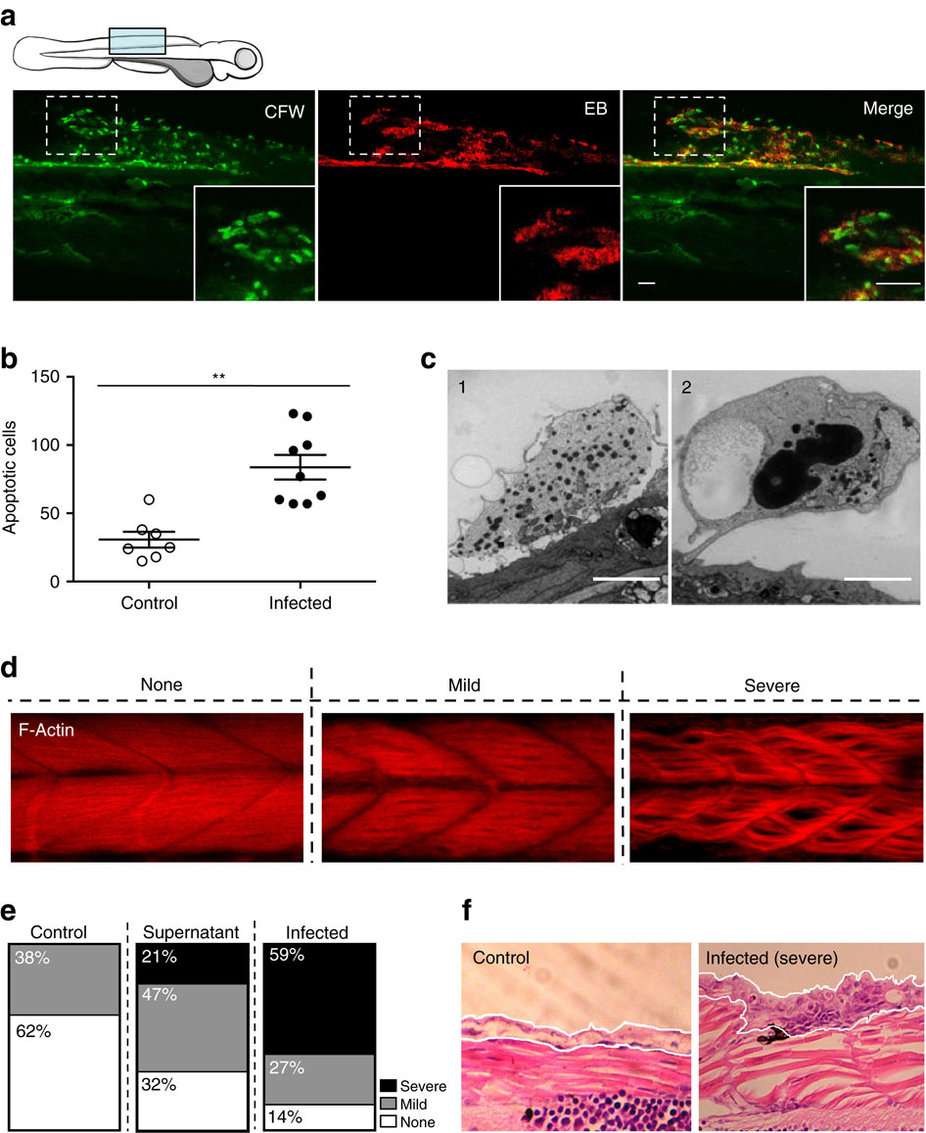
Consequence of Bd infection on zebrafish larvae host tissue.
(a) Zebrafish larvae bath water was inoculated with low (<200 zsp per μl) dose Bd zoospores and incubated for 72 h.p.i., then labelled with calcoluor white (CFW; for chitin, green) and evans blue (EB; for tissue damage, red), and visualized by confocal microscopy. Images taken at × 40, maximum intensity projection of Z-stack shown here. Cartoon depicts imaged region. Representative images with insets highlight colocalization of CFW-labelled punctae with EB positive tissue damage. Scale bars, 50 μm. See also Supplementary Fig. 3a for more examples. (b) Enumeration of apoptotic cells from larvae whose bath water was inoculated with mTGhL plate washings (control, open circles) or low (filled circles) dose Bd zoospores and incubated for 72 h.p.i., then fixed and labelled with TUNEL. Each point represents an individual larva. Data pooled from three experiments, using n=3 per treatment. Mean±s.e.m. are shown. Significance testing performed using Mann–Whitney test (two tailed), **P<0.01. (c) Zebrafish larvae bath water was inoculated with high dose Bd zoospores and incubated for 72 h.p.i., then fixed for electron microscopy (EM). 1, Sloughing necrotic cell. 2, sloughed necrotic cell. Scale bars, 1 μm. See also Supplementary Fig. 3d for EM images of larvae treated with control. (d) Zebrafish larvae bath water was inoculated with control, high (>200 zsp per μl) dose Bd zoospore supernatant or high dose Bd zoospores and incubated for 72 h.p.i., then fixed, labelled with phalloidin (for F-Actin; red) and visualized by confocal microscopy. Images taken at 40X, maximum intensity projection of Z-stack shown here. Representative images of larva with no, mild or severe muscle degeneration are shown here. (e) Proportion of larvae with no (white), mild (grey) or severe (black) muscle degeneration when prepared as in d. (f) Zebrafish larvae bath water was inoculated with control or high dose Bd zoospores and incubated for 72 h.p.i. Representative longitudinal histological sections shown here. White outline highlights skin of larvae, which in infected image shows hyperplasia of epithelial cells with mature and discharged sporangia.