
- Title
-
A Functional Bioluminescent Zebrafish Screen for Enhancing Hematopoietic Cell Homing
- Authors
- Astuti, Y., Kramer, A.C., Blake, A.L., Blazar, B.R., Tolar, J., Taisto, M.E., Lund, T.C.
- Source
- Full text @ Stem Cell Reports
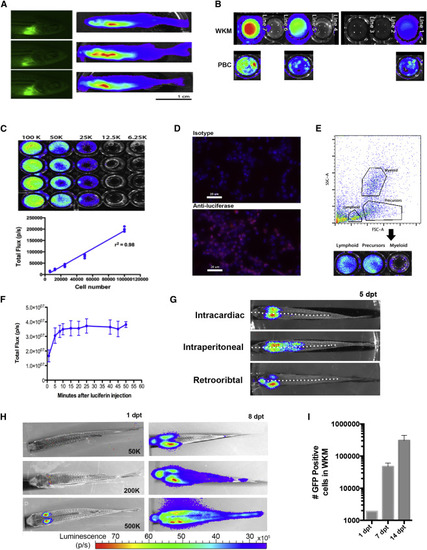
Luciferase Expression in ubi:luc Zebrafish (A) Adult founder zebrafish with EGFP fluorescent hearts (cmlc:EGPF) derived from the Tol2 backbone. Whole-body BLI visualized after intraperitoneal injection of D-luciferin. Three of 20 potential founder lines are shown. (B) WKM correlates with PBC BLI from three F2 fish lines. (C) Limiting dilution of WKM from ubi:luc indicates a linear BLI signal with detection to 6,250 cells in vitro. Data shown are mean ± SD and r2 from Pearson's correlation (n = 6 wells per cell concentration). (D) Immunostaining of cytopspun ubi:luc WKM cells showing luciferase expression cells. Anti-mouse IgG1-Cy3 secondary antibody was used for detection and DAPI was used as a nuclear stain. (E) Zebrafish WKM from ubi:luc was sorted by flow cytometry into lymphoid, precursor, and myeloid subpopulations based on forward- and side-scatter gating followed by BLI in a 96-well plate. (F) Zebrafish received 20 Gy radiation, underwent HCT with 500,000 ubi:luc donor cells, and were allowed to engraft for 28 days. To determine an optimal time for BLI acquisition, recipient fish were injected with 5 μL of 15 mg/mL D-luciferin in PBS and then serially imaged on an IVIS imaging system. Data shown are mean ± SD (n = 5 individual zebrafish). (G) Examples of WKM engraftment after three injection routes. A total of 200,000 ubi:luc WKM cells was delivered 2 days after recipients received 20 Gy X-ray radiation. BLI was performed at 5 days post-transplant (dpt). The dotted white lines represent the mid-line of the fish body. (H) ubi:luc WKM can be detected at 1 dpt. Animals underwent HCT with the indicated number of WKM cells delivered via intracardiac injection. (I) Rapid expansion of ubi:luc x h2afv:GFP donor WKM. HCT was performed with 200,000 donors cells. WKM was harvested at the given time points, and GFP donor cells enumerated by flow cytometry. Shown are mean ± SD (n = 6 individual zebrafish). See also Figure S1. |
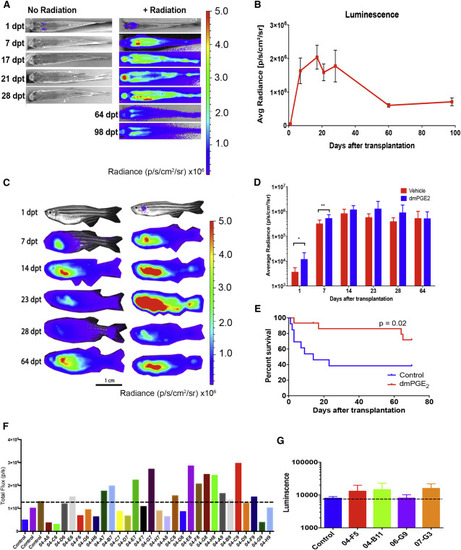
Small-Molecule Screening to Enhance Homing of Donor Cells (A) Serial BLI of non-irradiated and 20-Gy-irradiated recipients receiving 500,000 ubi:luc WKM cells. (B) Average ± SD radiance of engrafted recipients over time, n = 6 individuals/group. (C) Serial BLI of recipients transplanted with vehicle- and dmPGE2-treated ubi:luc WKM cells. (D) BLI quantification of recipients in vehicle- and dmPGE2-treated groups, n = 13 individuals/group, data shown are mean ± SD, ∗p < 0.05, ∗∗p < 0.01, from a Student's t test. (E) Survival of recipients from control and dmPGE2-treated groups is significantly different, n = 13 individuals/group. (F) Example of the BLI readout from a series of tested compounds. All recipients received 200,000 ubi:luc donor cells co-incubated with 10 μM of compound prior to HCT. Each bar represents one animal. The dashed line shows the highest BLI in one of three control animals for that experimental group. (G) Second screen of initial hits with n = 3–5 animals per compound. Data show a dashed line at the control mean ± SD. This example shows compound 04-B11 (ergosterol) that was examined in follow-up studies. |
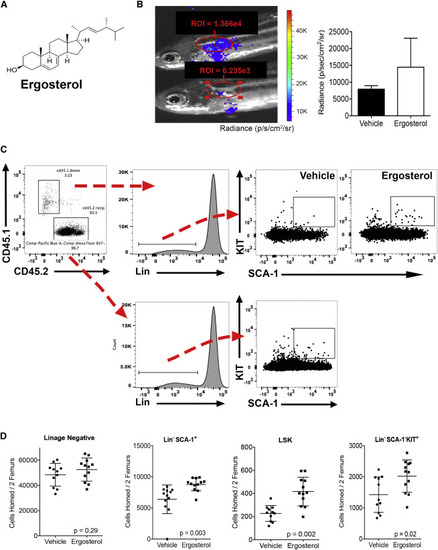
Ergosterol Enhances Murine Hematopoietic Cell Homing (A) Structure of ergosterol, a member of the sterol family of compounds. (B) BLI at 1 dpt of fish receiving ergosterol-treated cells in the secondary screen. The region of Interest (ROI) and donor cell radiance values of the WKM are shown. Some residual signal can be seen at the injection site. Right panel shows difference in radiance between vehicle and ergosterol-treated homed donor cells. Data shown are mean ± SD from five individual recipients. (C) Flow cytometry gating for the identification of Lin−SCA-1+KIT + donor cells after murine HCT. Initial gates were used to identify mononuclear cells that were propidium iodide (PI) negative. (D) Ten million CD45.1 donor cells in 50 μM ergosterol (circulating concentration estimated at 10 μM) or equal v/v vehicle were transplanted into CD45.2 lethally irradiated recipients. Bilateral femur marrow was harvested from recipients 16 hr post-transplant. Flow cytometry was used to quantify absolute numbers of homed donor cells using the gating strategy in (C). Data shown are mean ± SD and p values from a Student's t test (n = 10–11 animals/group in two pooled experiments). |
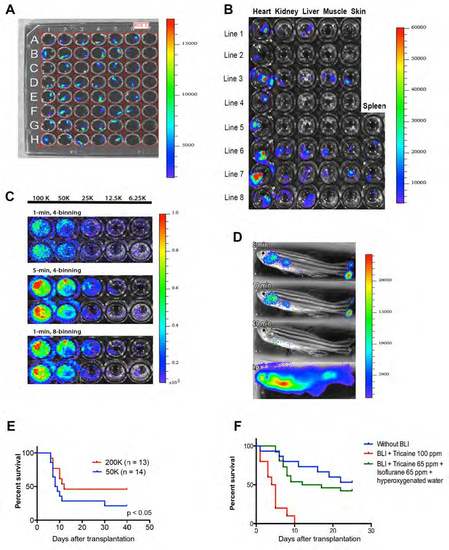
Luciferase expression in ubi:luc zebrafish and modifications of BLI to detect WKM cells. (A) Single cell stage zebrafish were injected with 100 ng/μL of the Tol2 ubi:luc construct. Founder ubi:luc zebrafish embryos (96 hours post fertilization) were placed in a 96-well plate after the addition of D-luciferin to the water . (B) Organs dissected from F2 zebrafish and BLI performed after the addition of Dluciferin to the water (150 mg/mL) indicating BLI variability in several lines. (C) Limiting dilution with WKM from ubi:luc zebrafish in a 96-well plate followed by the addition 150 μg/mL D-luciferin to the water. Acquisition time set at 1 minute and CCD resolution set at 4 pixel binning gave good signal sensitivity but high background scatter. When acquisition time was increased to 5 minutes (middle panel) or resolution set to 8 pixel binning (lower panel), both BLI sensitivity and localization improved without interference from background signal. (D) Bathing versus intraperitoneal injection of D-luciferin in transplant recipients. Lethally irradiated wild-type zebrafish received 100,000 ubi:luc WKM cells and allowed to engraft for 28 days. Imaging was performed using a Xenogen IVIS50 (Stage A). Exposure time was set at 1 minute. Animals were immobilized using 0.005% tricaine in a 6-well plate filled with 1% agarose gel with a portion removed to isolate the animal. Bathing was performed by placing zebrafish in D-luciferin in fish water at 150 μg/mL for the indicated lengths of time (top three panels). Intraperitoneal injection (lower panel) of 75 μg D-luciferin was performed immediately prior to BLI imaging (exposure time was set at 1 minute as before). (E) Short-term survival is increased in zebrafish receiving a higher cell dose after HCT. Recipients received 30 Gy, followed by HCT with 50,000 or 200,000 ubi:luc WKM cells. Animals were followed for 40 days. P-value from a Student’s t-test. (F) Modification to anesthesia protocol. Wild-type recipients underwent HCT with 200,000 ubi:luc donor cells with BLI performed at 1 dpt and 5 dpt using the anesthesia as listed, n = 10/group. All luminescence scale bars show radiance (p/sec/cm2/sr). |