
Fig. 1
- ID
- ZDB-FIG-170220-20
- Publication
- Astuti et al., 2017 - A Functional Bioluminescent Zebrafish Screen for Enhancing Hematopoietic Cell Homing
- Other Figures
- All Figure Page
- Back to All Figure Page
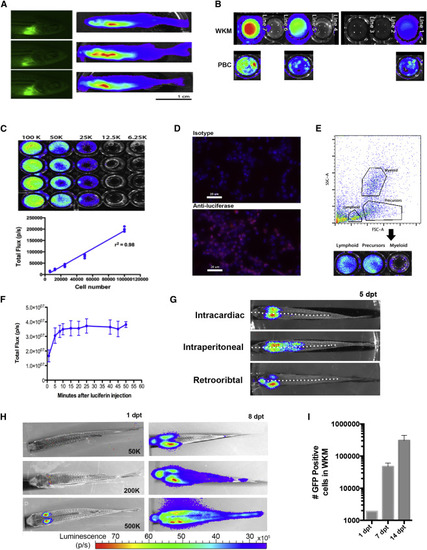
Luciferase Expression in ubi:luc Zebrafish (A) Adult founder zebrafish with EGFP fluorescent hearts (cmlc:EGPF) derived from the Tol2 backbone. Whole-body BLI visualized after intraperitoneal injection of D-luciferin. Three of 20 potential founder lines are shown. (B) WKM correlates with PBC BLI from three F2 fish lines. (C) Limiting dilution of WKM from ubi:luc indicates a linear BLI signal with detection to 6,250 cells in vitro. Data shown are mean ± SD and r2 from Pearson's correlation (n = 6 wells per cell concentration). (D) Immunostaining of cytopspun ubi:luc WKM cells showing luciferase expression cells. Anti-mouse IgG1-Cy3 secondary antibody was used for detection and DAPI was used as a nuclear stain. (E) Zebrafish WKM from ubi:luc was sorted by flow cytometry into lymphoid, precursor, and myeloid subpopulations based on forward- and side-scatter gating followed by BLI in a 96-well plate. (F) Zebrafish received 20 Gy radiation, underwent HCT with 500,000 ubi:luc donor cells, and were allowed to engraft for 28 days. To determine an optimal time for BLI acquisition, recipient fish were injected with 5 μL of 15 mg/mL D-luciferin in PBS and then serially imaged on an IVIS imaging system. Data shown are mean ± SD (n = 5 individual zebrafish). (G) Examples of WKM engraftment after three injection routes. A total of 200,000 ubi:luc WKM cells was delivered 2 days after recipients received 20 Gy X-ray radiation. BLI was performed at 5 days post-transplant (dpt). The dotted white lines represent the mid-line of the fish body. (H) ubi:luc WKM can be detected at 1 dpt. Animals underwent HCT with the indicated number of WKM cells delivered via intracardiac injection. (I) Rapid expansion of ubi:luc x h2afv:GFP donor WKM. HCT was performed with 200,000 donors cells. WKM was harvested at the given time points, and GFP donor cells enumerated by flow cytometry. Shown are mean ± SD (n = 6 individual zebrafish). See also Figure S1. |