
- Title
-
Molecular insights into Adgra2/Gpr124 and Reck intracellular trafficking
- Authors
- Bostaille, N., Gauquier, A., Twyffels, L., Vanhollebeke, B.
- Source
- Full text @ Biol. Open
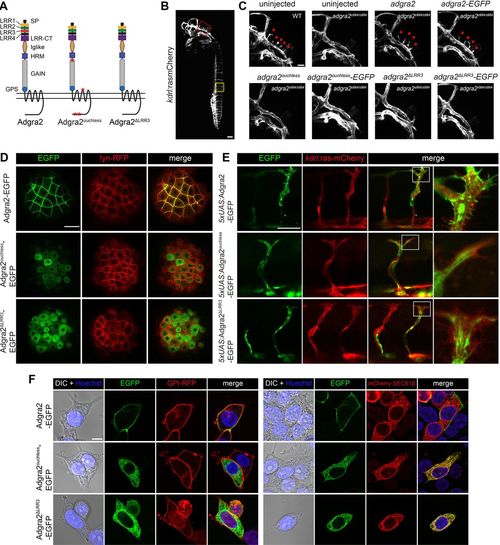
Adgra2ouchless mislocalizes to the endoplasmic reticulum. (A) Schematic representation of Adgra2, Adgra2ouchless and Adgra2ΔLRR3 topology and domain organization. Adgra2ouchless and Adgra2ΔLRR3 lack the third LRR motif (red rectangle). The positions of the residue variations resulting from naturally occurring SNPs in adgra2ouchless are designated by red asterisks. (B) Maximal intensity projection of a confocal z-stack of a WT Tg(kdrl:ras-mCherry) embryo at 36 hpf in lateral view. The red and yellow boxes define, respectively, the magnified areas of the hindbrain vasculature shown in C and the intersegmental vessels shown in E. Scale bar: 100 µm. (C) Maximal intensity projection of a confocal z-stack of WT and adgra2s984/984 Tg(kdrl:ras-mCherry) embryos at 36 hpf in lateral view after injection of 100 pg of adgra2, adgra2-EGFP, adgra2ouchless, adgra2ouchless-EGFP, adgra2ΔLRR3 or adgra2ΔLRR3-EGFP mRNA at the one-cell stage. The red arrowheads point to the CtAs invading the hindbrain rhombomeres. Scale bar: 50 µm. (D) Single-plane confocal scans through enveloping layer cells of 5 hpf blastulas injected at the one-cell stage with 50 pg of lyn-RFP mRNA together with 100 pg of adgra2-EGFP, adgra2ouchless-EGFP or adgra2ΔLRR3-EGFP mRNA. Scale bar: 50 µm. (E) Single-plane confocal scans through the trunk intersegmental vessels of 30 hpf double-transgenic Tg(kdrl:ras-mCherry); Tg(fliep:Gal4FF) embryos injected at the one-cell stage with 25 pg of Tol2 transposase mRNA and 25 pg of the pTol2-5xUAS:adgra2-EGFP, pTol2-5xUAS:adgra2ouchless-EGFP and pTol2-5xUAS:adgra2ΔLRR3-EGFP constructs. Boxes define magnified views of the tip cells presented in the column on the right. Scale bar: 50 µm. (F) Single-plane direct fluorescence confocal scans of non-permeabilized HEK293T cells 48 h after transfection with GPI-RFP, mCherry-SEC61β, Adgra2-EGFP, Adgra2ouchless-EGFP or Adgra2ΔLRR3-EGFP encoding constructs. Cells were additionally transfected with reck and Wnt7a (mouse gene) expression constructs. Nuclei were counterstained with Hoechst. Scale bar: 10 μm. |
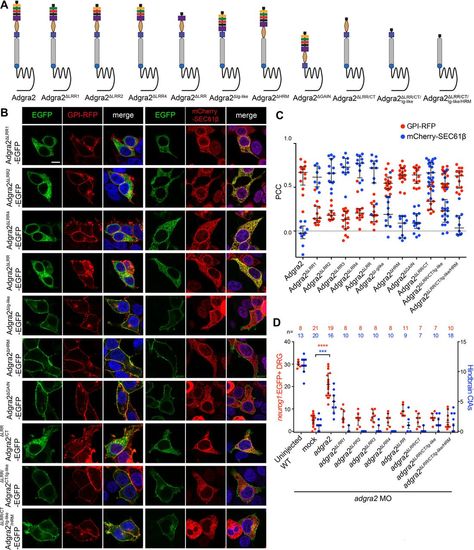
LRR/CT-dependent Adgra2 intracellular trafficking. (A) Schematic representation of Adgra2, Adgra2ΔLRR1, Adgra2ΔLRR2, Adgra2ΔLRR4, Adgra2ΔLRR, Adgra2ΔIg-like, Adgra2ΔHRM, Adgra2ΔGAIN, Adgra2ΔLRR/CT, Adgra2ΔLRR/CT/Ig-like and Adgra2ΔLRR/CT/Ig-Like/HRM domain organization. See Fig. 1A for schematic labels. (B) Single-plane direct fluorescence confocal scans of non-permeabilized HEK293T cells 48 h after transfection with the indicated adgra2 variants together with the GPI-RFP membrane marker or the mCherry-SEC61β ER marker. Cells were additionally transfected with reck and Wnt7a (mouse gene) expression constructs. Nuclei were counterstained with Hoechst. Scale bar: 10 μm. (C) Colocalization assessment of Adgra2 and its variants with the membrane marker GPI-RFP (red dots) or the ER marker mCherry-SEC61β (blue dots) using the Pearson correlation coefficient. Error bars represent median±interquartile range. (D) Quantification of neurog1:EGFP+ DRG at 72 hpf (red dots) and hindbrain CtAs at 60 hpf (blue dots) in WT and adgra2 morphant larvae and embryos injected at the one-cell stage with 100 pg RNA encoding Adgra2 or Adgra2 variants. Error bars represent median±interquartile range (***P<0.001; ****P<0.0001; Kruskal–Wallis test). |

Cellular distribution of Adgra2 LRR/CT domain hybrids. (A) Schematic representation of chimeric Adgra2 receptors in which Adgra2 LRR3 is substituted with the LRR7 (blue hashed rectangle) of CPN2 (CPN2LRR7), the LRR1 of Adgra2 (Adgra2LRR1), the LRR2 of Adgra2 (Adgra2LRR2) or the LRR3 (red hashed rectangle) of Adgra3 (Adgra3LRR3). See Fig. 1A for schematic labels. (B) Sequence alignment of the LRR motifs illustrated in A. Identical amino acids are highlighted in gray. (C) Single-plane direct fluorescence confocal scans of non-permeabilized HEK293T cells 48 h after transfection with GPI-RFP, mCherry-SEC61β and Adgra2 hybrid-encoding constructs. Cells were additionally transfected with reck and Wnt7a (mouse gene) expression constructs. Nuclei were counterstained with Hoechst. Scale bar: 10 μm. (D) Colocalization assessment of Adgra2 and its variants with the membrane marker GPI-RFP (red dots) or the ER marker mCherry-SEC61β (blue dots) using the Pearson correlation coefficient. Error bars represent median±interquartile range. (E) Quantification of neurog1:EGFP+ DRG at 72 hpf (red dots) and hindbrain CtAs at 60 hpf (blue dots) in WT and adgra2 morphant larvae and embryos injected at the one-cell stage with 100 pg of adgra2 or adgra2 hybrid mRNA. Error bars represent median±interquartile range (***P<0.001; ****P<0.0001; Kruskal–Wallis test). |
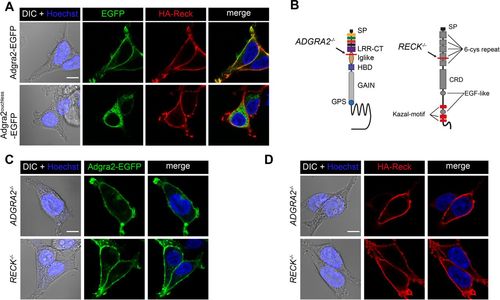
Independent trafficking of Reck and Adgra2 to the plasma membrane. (A) Single-plane confocal images of non-permeabilized HEK293T cells 48 h after transfection with HA-reck and adgra2-EGFP variants, as indicated. (B) Schematic representation of the genetic lesions of ADGRA2−/− and RECK−/− cells. The position of the frame-shift mutation is indicated by the red line. See Fig. 1A for schematic labels. (C,D) Single-plane confocal images of non-permeabilized ADGRA2−/− and RECK−/− HEK293T cells 48 h after transfection with adgra2-EGFP (C) and HA-reck (D) constructs. In all panels, EGFP is detected by direct fluorescence and the HA-Reck fusion by anti-HA indirect immunofluorescence. Cells were additionally transfected with a Wnt7a (mouse gene) expression construct. Nuclei were counterstained with Hoechst. Scale bars: 10 μm. |
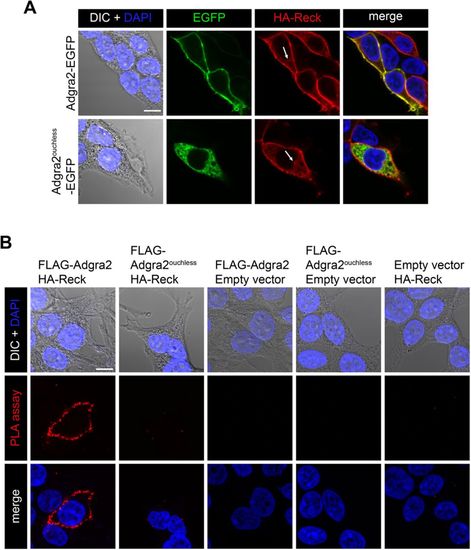
Cellular distribution of Adgra2 and Reck interaction. (A) Single-plane confocal images of saponin-permeabilized HEK293T cells 48 h after transfection with HA-reck and adgra2-EGFP variants, as indicated. Nuclei were counterstained with DAPI. EGFP is detected by direct fluorescence and the HA-Reck fusion by anti-HA indirect immunofluorescence. Arrows point to the ER. (B) Proximity ligation assays in HEK293T cells 48 h after transfection with FLAG-adgra2, FLAG-adgra2ouchless and HA-reck constructs, as indicated. Nuclei were counterstained with DAPI. In all panels, cells were additionally transfected with a Wnt7a (mouse gene) expression construct. Scale bar: 10 μm. |