
Fig. 2
- ID
- ZDB-FIG-171006-19
- Publication
- Bostaille et al., 2016 - Molecular insights into Adgra2/Gpr124 and Reck intracellular trafficking
- Other Figures
- All Figure Page
- Back to All Figure Page
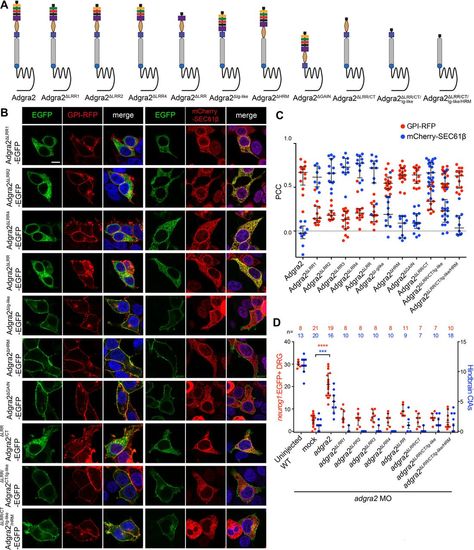
LRR/CT-dependent Adgra2 intracellular trafficking. (A) Schematic representation of Adgra2, Adgra2ΔLRR1, Adgra2ΔLRR2, Adgra2ΔLRR4, Adgra2ΔLRR, Adgra2ΔIg-like, Adgra2ΔHRM, Adgra2ΔGAIN, Adgra2ΔLRR/CT, Adgra2ΔLRR/CT/Ig-like and Adgra2ΔLRR/CT/Ig-Like/HRM domain organization. See Fig. 1A for schematic labels. (B) Single-plane direct fluorescence confocal scans of non-permeabilized HEK293T cells 48 h after transfection with the indicated adgra2 variants together with the GPI-RFP membrane marker or the mCherry-SEC61β ER marker. Cells were additionally transfected with reck and Wnt7a (mouse gene) expression constructs. Nuclei were counterstained with Hoechst. Scale bar: 10 μm. (C) Colocalization assessment of Adgra2 and its variants with the membrane marker GPI-RFP (red dots) or the ER marker mCherry-SEC61β (blue dots) using the Pearson correlation coefficient. Error bars represent median±interquartile range. (D) Quantification of neurog1:EGFP+ DRG at 72 hpf (red dots) and hindbrain CtAs at 60 hpf (blue dots) in WT and adgra2 morphant larvae and embryos injected at the one-cell stage with 100 pg RNA encoding Adgra2 or Adgra2 variants. Error bars represent median±interquartile range (***P<0.001; ****P<0.0001; Kruskal–Wallis test). |