
|
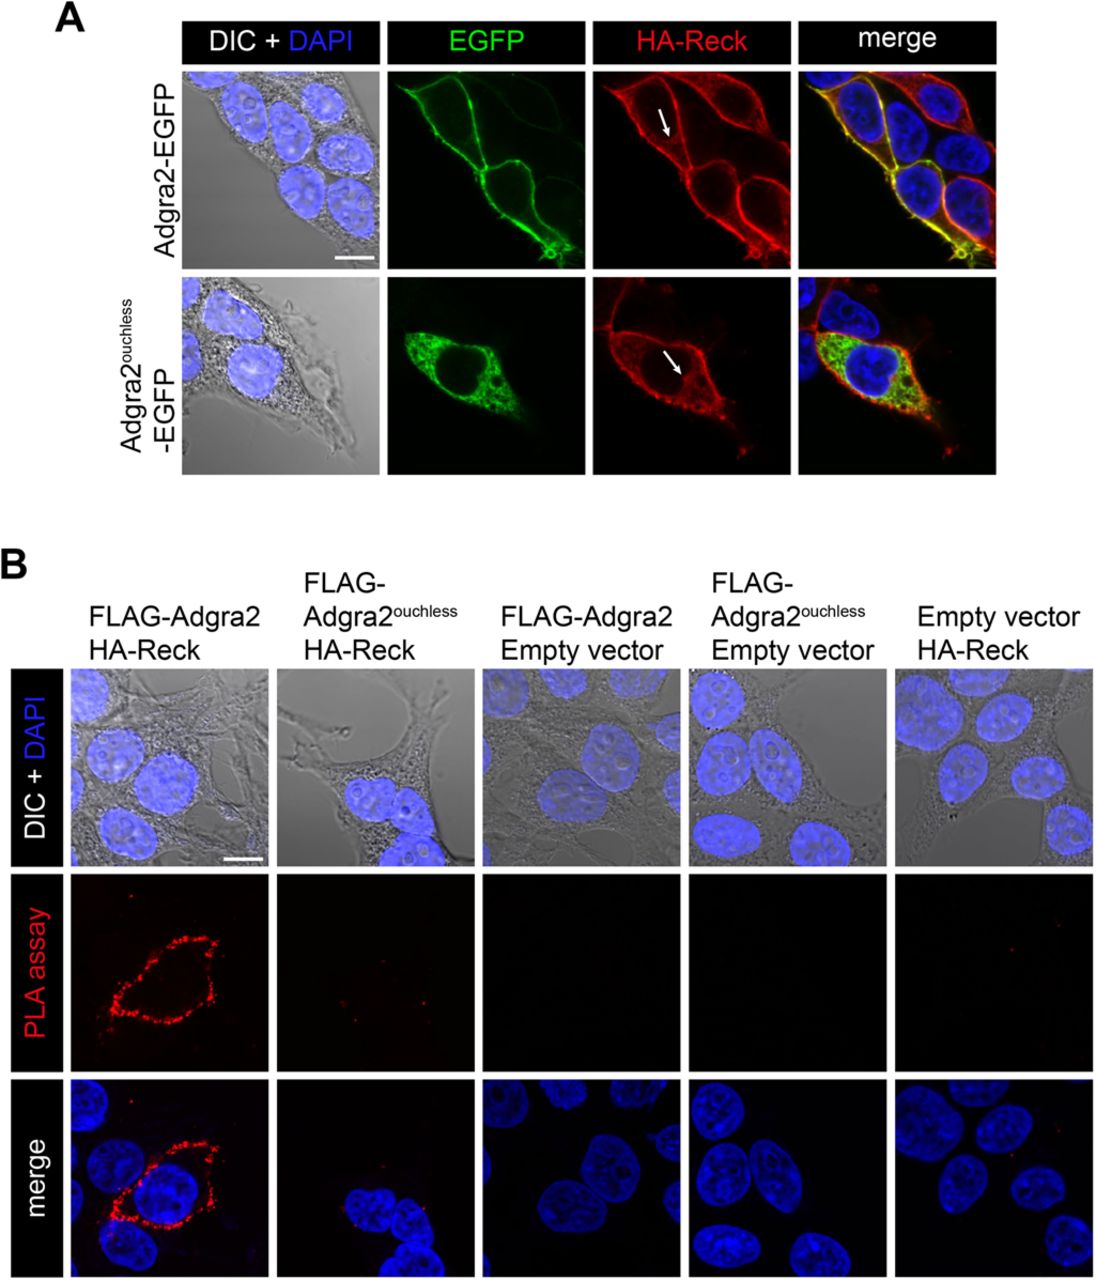
Fig. 5
Cellular distribution of Adgra2 and Reck interaction. (A) Single-plane confocal images of saponin-permeabilized HEK293T cells 48 h after transfection with HA-reck and adgra2-EGFP variants, as indicated. Nuclei were counterstained with DAPI. EGFP is detected by direct fluorescence and the HA-Reck fusion by anti-HA indirect immunofluorescence. Arrows point to the ER. (B) Proximity ligation assays in HEK293T cells 48 h after transfection with FLAG-adgra2, FLAG-adgra2ouchless and HA-reck constructs, as indicated. Nuclei were counterstained with DAPI. In all panels, cells were additionally transfected with a Wnt7a (mouse gene) expression construct. Scale bar: 10 μm.