
- Title
-
Molecular fingerprinting delineates progenitor populations in the developing zebrafish enteric nervous system
- Authors
- Taylor, C.R., Montagne, W.A., Eisen, J.S., Ganz, J.
- Source
- Full text @ Dev. Dyn.
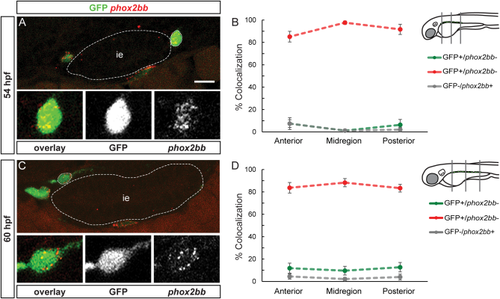
phox2bb:EGFP exhibits a high degree of colocalization with phox2bb mRNA. A and C show confocal images of cross-sections through the trunk. At 54 (A) and 60 (C) hpf, phox2bb mRNA (red) largely colocalizes with phox2bb:EGFP (green). Insets show enlargements of outlined cells, overlay, phox2bb:EGFP, phox2bb mRNA (from left to right). At 54 (B) and 60 (D) hpf, quantification in percent of phox2bb:EGFP and phox2bb mRNA colocalization in the three regions analyzed. Note that the dotted line between the measured values does not show the continuous percentage of coexpression between the anterior, mid and posterior values, but is drawn to facilitate visualization of coexpression trends. ie, intestinal epithelium. Scale bar = 10 μm. |
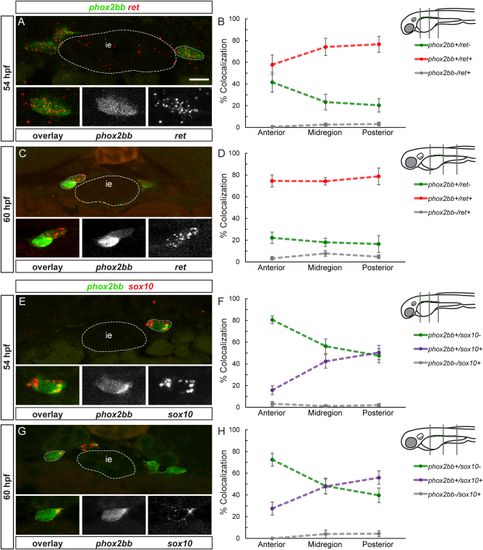
sox10 and ret are differentially expressed in two different progenitor subpopulations. A, C, E and G show confocal images of cross-sections through the trunk. At 54 (A) and 60 (C) hpf, ret mRNA (red) colocalizes with phox2bb (green). Insets show enlargements of outlined cells, overlay, phox2bb, ret mRNA (from left to right). Note that phox2bb refers to phox2bb:EGFP expression as described in the text. At 54 (B) and 60 (D) hpf quantification in percent of phox2bb and ret colocalization in the three regions analyzed. At 54 (E) and 60 (G) hpf, sox10 mRNA (red) partially colocalizes with phox2bb (green). Insets show enlargement of outlined cell, overlay, phox2bb, sox10 mRNA (from left to right). At 54 (F) and 60 (H) hpf, quantification in percent of phox2bb and sox10 mRNA colocalization in the three regions analyzed. The dotted line between the measured values does not show the continuous percentage of coexpression between the anterior, mid and posterior values, but is drawn to facilitate visualization of coexpression trends. ie, intestinal epithelium. Scale bar = 10 μm. |

Colocalization of ret and sox10 with phox2bb reveals a total of three enteric progenitor subpopulations. A and C show confocal images of cross-sections through the trunk. At 54 (A) and 60 (C) hpf, phox2bb (green), ret mRNA (red) and sox10 mRNA (blue) colocalize in subpopulations. Insets show close-up of outlined cell(s), overlay, phox2bb, ret mRNA, sox10 mRNA (from left to right). Note that phox2bb refers to phox2bb:EGFP expression as described in the text. At 54 (B) and 60 (D) hpf, quantification in percent of phox2bb, ret and sox10 colocalization in the three regions analyzed. The dotted line between the measured values does not show the continuous percentage of coexpression between the anterior, mid and posterior values, but is drawn to facilitate visualization of coexpression trends. ie, intestinal epithelium. Scale bar = 10 μm. |
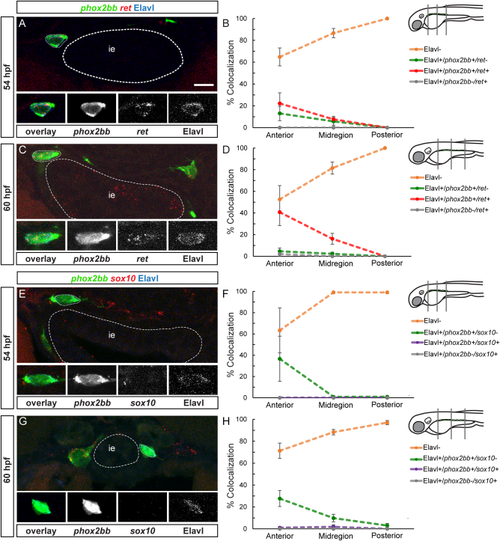
A small population of differentiating neurons express phox2bb and ret. A, C, E, and G show confocal images of cross-sections through the trunk. At 54 (A) and 60 (C) hpf, ret mRNA (red) colocalizes with Elavl (blue) and phox2bb (green). Insets show close-ups of outlined cell, overlay, phox2bb, ret mRNA, Elavl (from left to right). Note that phox2bb refers to phox2bb:EGFP expression as described in the text. At 54 (B) and 60 (D) hpf, quantification in percent of phox2bb, ret and Elavl colocalization in the three regions analyzed. At 54 (E) and 60 (G) hpf, sox10 mRNA (red) does not colocalize with Elavl positive (blue), phox2bb positive cells (green). Insets show close-up of outlined cell, overlay, phox2bb, sox10 mRNA, Elavl (from left to right). At 54 (F) and 60 (H) hpf, quantification in percent of phox2bb, sox10 and Elavl colocalization in the three regions analyzed. The dotted line between the measured values does not show the continuous percentage of coexpression between the anterior, mid and posterior values, but is drawn to facilitate visualization of coexpression trends. ie, intestinal epithelium. Scale bar = 10 μm. |
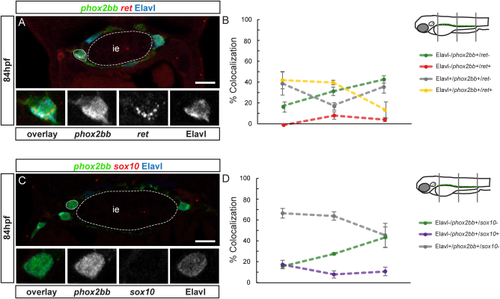
A small population of differentiating neurons express phox2bb and ret at later stages of neuronal differentiation. A and C show confocal images of cross-sections through the trunk. (A) At 84 hpf, ret mRNA (red) colocalizes with Elavl (blue) and phox2bb (green). Insets show close-ups of outlined cell, overlay, phox2bb, ret mRNA, Elavl (from left to right). Note that phox2bb refers to phox2bb:EGFP expression as described in the text. (B) At 84 hpf, quantification in percent of phox2bb, ret and Elavl colocalization in the three regions analyzed. (C) At 84 hpf, sox10 mRNA (red) does not colocalize with Elavl positive (blue), phox2bb positive (green) cells. Insets show close-up of outlined cell, overlay, phox2bb, sox10 mRNA, Elavl (from left to right). (D) At 84 hpf, quantification in percent of phox2bb, sox10 and Elavl colocalization in the three regions analyzed. The dotted line between the measured values does not show the continuous percentage of coexpression between the anterior, mid and posterior values, but is drawn to facilitate visualization of coexpression trends. ie, intestinal epithelium. Scale bar = 10 μm. |
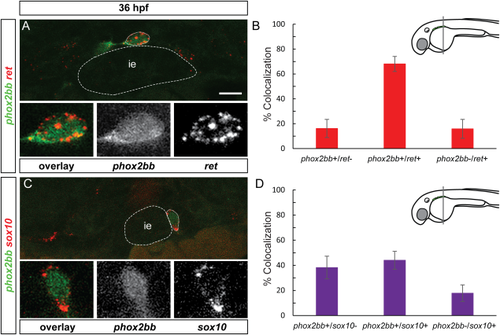
Enteric progenitor subpopulations are present at 36 hpf. A and C show confocal images of cross-sections through the trunk. (A) At 36 hpf, ret mRNA (red) partially colocalizes with phox2bb (green). Insets show close-up of outlined cell, overlay, phox2bb, ret mRNA (from left to right). Note that phox2bb refers to phox2bb:EGFP expression as described in the text. (B) Quantification in percent of phox2bb and ret colocalization at the wave front. (C) sox10 mRNA (red) partially colocalizes with phox2bb (green). Insets show close-up of outlined cell, overlay, phox2bb, sox10 mRNA (from left to right). (D) Quantification in percent of phox2bb and sox10 colocalization at the wave front. ie, intestinal epithelium Scale bar = 10 μm. |