
|
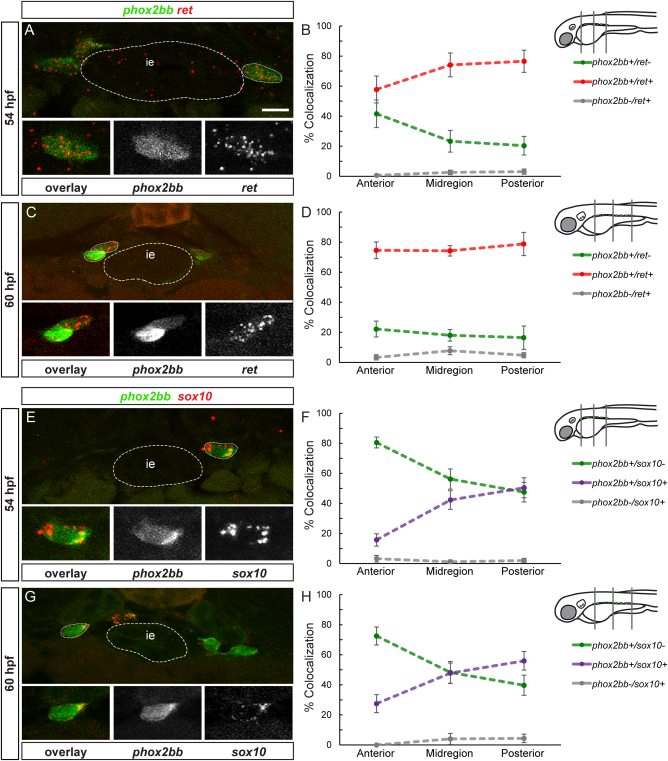
Fig. 3
sox10 and ret are differentially expressed in two different progenitor subpopulations. A, C, E and G show confocal images of cross-sections through the trunk. At 54 (A) and 60 (C) hpf, ret mRNA (red) colocalizes with phox2bb (green). Insets show enlargements of outlined cells, overlay, phox2bb, ret mRNA (from left to right). Note that phox2bb refers to phox2bb:EGFP expression as described in the text. At 54 (B) and 60 (D) hpf quantification in percent of phox2bb and ret colocalization in the three regions analyzed. At 54 (E) and 60 (G) hpf, sox10 mRNA (red) partially colocalizes with phox2bb (green). Insets show enlargement of outlined cell, overlay, phox2bb, sox10 mRNA (from left to right). At 54 (F) and 60 (H) hpf, quantification in percent of phox2bb and sox10 mRNA colocalization in the three regions analyzed. The dotted line between the measured values does not show the continuous percentage of coexpression between the anterior, mid and posterior values, but is drawn to facilitate visualization of coexpression trends. ie, intestinal epithelium. Scale bar = 10 μm.