
- Title
-
The zebrafish goosepimples/myosin Vb mutant exhibits cellular attributes of human microvillus inclusion disease
- Authors
- Sidhaye, J., Pinto, C.S., Dharap, S., Jacob, T., Bhargava, S., Sonawane, M.
- Source
- Full text @ Mech. Dev.
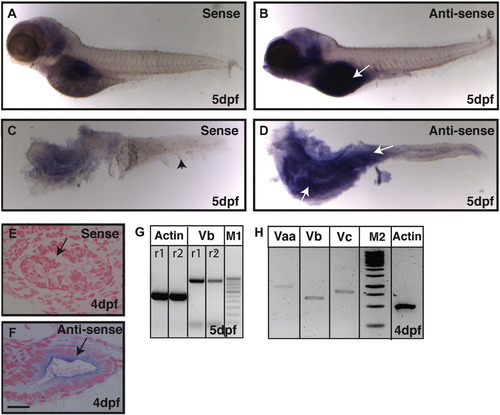
Expression analysis reveals that gsp/myoVb is expressed in the intestine of zebrafish larvae. In situ hybridisation analyses on 5-day-old larvae using sense control probe (A, C) and anti-sense probe against myosin Vb (B, D) in whole mount (A, B) and post-staining isolated intestines (C, D) reveal that myosin Vb is expressed in the intestine. The histological sections of 4dpf (E, F) larvae stained using sense control probe (E) and anti-sense probe (F) show the presence of myosin Vb transcripts in the gut epithelium. RT-PCR analyses performed on cDNA from intestines isolated from 4 and 5 day-old larvae show that myosin Vb (G) and other two myosin V paralogues, Vaa and Vc (H) are expressed in the intestine. Abbreviation: M1 - 100 bp ladder marker. M2 - 1Kb ladder marker. The white arrows (in B and D) point towards the expression of myoVb. The black arrowhead in C points to the median fin-fold. The black arrows in (E, F) indicate the gut epithelium. r1 and r2 are PCR reactions 1 and 2, respectively. Note that the difference between the myo Vb amplicon size in G and H is due to two different primer pairs used. Scale bar in F is equal to 20 μm in E, F. |
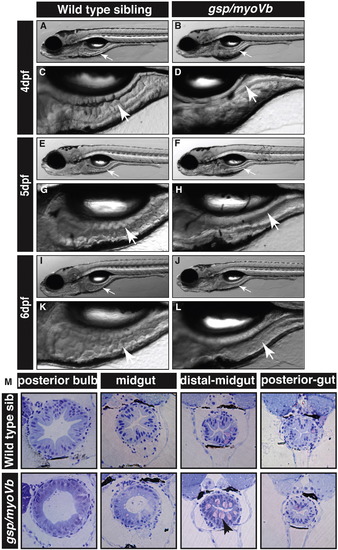
The zebrafish gsp/myoVb mutant exhibits a smooth intestine phenotype during 4 to 6 days post-fertilisation. The bright field images of developing zebrafish wild type larvae (A, E, I) and their intestines (C, G, K) exhibit rough intestinal walls indicating the presence of tissue folds. The gsp/myoVb mutant larvae (B, F, J) and their intestines (D, H, L) show smooth intestinal walls suggesting absence of intestinal folds. Arrows point to the intestine in all images. Histological sections (M) of different parts of the gut of wild type sibling and gsp/myoVb mutant. In total 4 wild type siblings and 4 mutants were analysed by histology. Abbreviation: sib = sibling. |
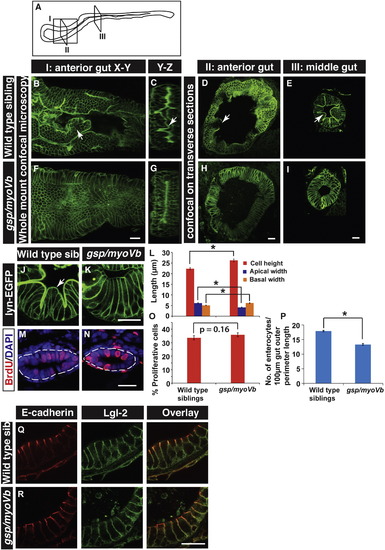
The loss of intestinal folds in gsp/myoVb mutants is accompanied by changes in cell shapes. A schematic showing various regions of the zebrafish larval gut (A). The boxed regions indicate the parts of the intestine where whole mounts were imaged (I) or intestines were sectioned (II, III). Confocal images of the whole mount (B, F), orthogonal sections (C, G), immuno-histological sections (D, E, H, I, J, K) of wild type sibling (B, C, D, E, J) and gsp/myoVb mutant (F, G, H, I, K) intestines stained for lyn-EGFP at 6dpf. Note the absence of intestinal folds in the gsp/myoVb mutants. The whole mount analysis was done on 4 siblings and 3 mutants whereas the immunohistology analysis was done on 9 siblings and 7 mutants. Bar graph (L) showing measurements of the height, apical width and basal width of enterocytes in wild type and gsp/myoVb mutant larvae at 6dpf. The enterocytes are taller and have a narrower apical domain in the gsp/myoVb mutants as compared to wild type. BrdU staining in wild type (M) and gsp/myoVb mutant larvae (N) at 3dpf followed by estimation of proliferation indices, which are represented in a bar graph (O). Number of enterocytes per 100 μm gut perimeter length was estimated from sections for 6-day-old wild type and gsp/myoVb mutant larvae and shown in a bar graph (P). Immuno-histological sections of zebrafish intestine in the wild type (Q) and gsp/myoVb mutant larvae (R) stained using anti E-cadherin and anti-Lgl2 antibodies. Arrows in B–E and J point to the intestinal folds. The square brackets show the comparison and asterisks indicate the statistically significant difference at p < 0.05 by Student's t-test. The error bars in L, O, and P represent SEM. Scale bars are equivalent to 20 μm. Abbreviation: sib = sibling. EXPRESSION / LABELING:
PHENOTYPE:
|
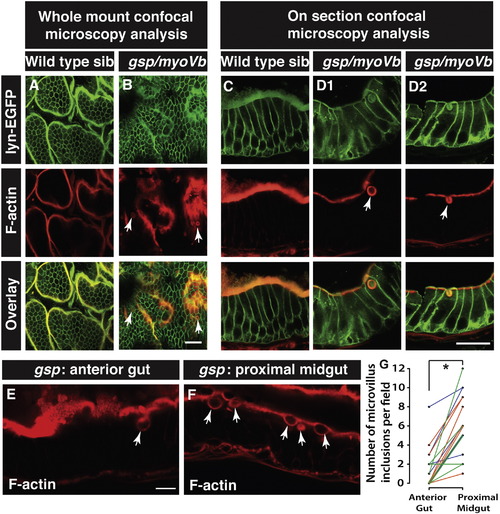
Enterocytes in gsp/myoVb mutants show presence of microvillus inclusions. Confocal .microscopy analysis of whole mount (A, B) and cryosections (C, D1, D2) of the anterior gut of wild type sibling (A, C) and gsp/myoVb mutant (B, D1, D2) larvae stained for lyn-EGFP and F-actin (phalloidin) at 6dpf. In all, 3 mutants and 4 siblings were examined in whole mounts whereas 7 mutants and 7 siblings were analysed by cryosectioning. Confocal sections of anterior gut (E) and proximal midgut (F) from the same gsp/myoVb mutant stained for phalloidin. In total 17 mutant animals from three different sets were analysed this way. The graph (G) shows the comparison between the number of inclusions in the anterior versus proximal midgut in mutants. Each line indicates one animal and different colours indicate values from different experimental sets. The arrows indicate phalloidin or lyn-EGFP labelled inclusion bodies in enterocytes. The asterisk represents statistically significant difference (p < 0.0001) by paired t-test. Scale bars: in B and D2 = 20 μm and in E = 10 μm. Abbreviation: sib = sibling. PHENOTYPE:
|

Shorter microvilli and microvillus inclusions, the main attributes of MVID, are present in enterocytes of gsp/myoVb mutants. Electron micrographs of thin sections, passing through the enterocytes of 6dpf wild type (A, C) and gsp/myoVb mutant larvae (B, D–G). Note the absence of microvilli (B), the reduction in microvillus length (D) and presence of microvillus inclusions (B, E–G) in gsp/myoVb enterocytes as compared to wild type enterocytes (A). The image shown in G is a high magnification image of the inclusion seen in Fig. 7I. The bar graph (H) shows the difference in the microvillar length in the midgut of wild type siblings and gsp mutants. For the EM analysis, we used 4 siblings and 5 mutant animals. The length measurements were done on 137 microvilli from 49 enterocytes of 4 siblings and on 95 microvilli from 33 enterocytes of 3 mutants. The white arrowheads indicate microvillus inclusions whereas the black arrows (in A-C) point to microvilli. A black arrowhead in (B) points to the loss of microvilli whereas a black arrow in (G) points to terminal web surrounding the microvillus inclusion. The square bracket shows the comparison and asterisk indicates that the difference is statistically significant by an unpaired t-test with unequal variance at p < 0.0001. The error bars in H represent the SD. Scale bars correspond to 1 μm. PHENOTYPE:
|
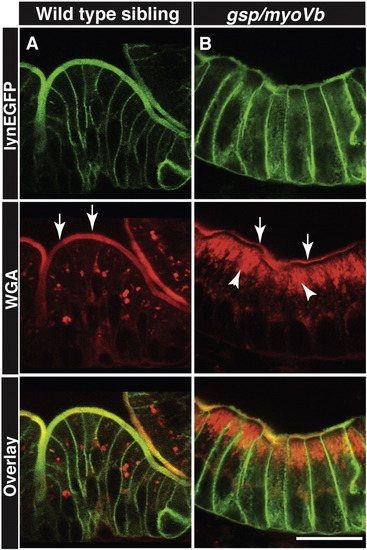
Secretory material accumulates in the enterocytes of gsp/myoVb mutant larvae. Immunohistology on 6dpf wild type siblings (A) and gsp/myoVb mutant (B) intestine using anti-GFP antibody and Alexa fluor 594 conjugated WGA. The white arrows point to the WGA labelling of apical domain of the wild type and mutant enterocytes whereas the arrowheads point to the intracellular staining. Note the considerable decrease in apical staining and concomitant increase in intracellular staining in gsp/myoVb mutant. For this analysis, we checked 3 siblings and 4 mutants by histology. The scale bar is equivalent to 20 μm. PHENOTYPE:
|
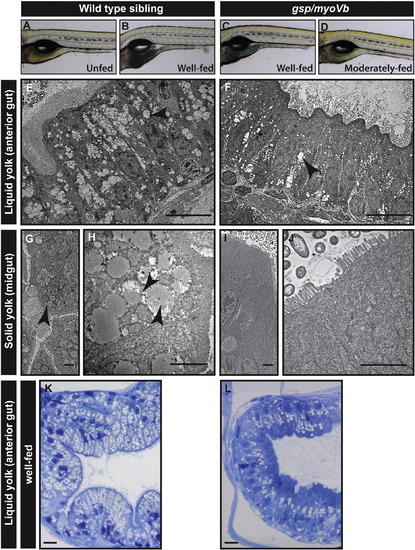
Lipid absorption is decreased in gsp/myoVb mutant larvae. Bright field images (A–D) of wild type (A, B) and mutant larvae (C, D), either unfed (A) or fed with coloured emulsified yolk (B–D). Electron micrograph of enterocytes from wild type siblings (E, G, H) and gsp/myoVb mutant larvae (F, I, J) fed with liquid yolk (E, F) and solid yolk (low magnification G, I; higher magnification H, J). Histological sections of the anterior gut of well-fed wild-type sibling (K) and gsp/myoVb (L) larvae. The micrographs of liquid yolk fed larval enterocytes were taken in the anterior part of the gut whereas the solid yolk fed larval enterocytes were imaged in the midgut. Note that while the absorption is low in the anterior gut in gsp/myoVb mutant larvae, it is almost absent in the midgut. The EM analysis was done on 3 wild type siblings and 3 mutants out of 9 animals of each genotype, which were additionally analysed by histology (not shown). In the second set, 3 well-fed siblings and 4 well-fed mutants were preselected and used for histological analysis. The representative images for this set are presented in K and L. The black arrowheads point towards the lipid droplets in the enterocytes. Scale bars: in E, F, K and L corresponds to 10 μm, in G, H, I, and J correspond to 2 μm. PHENOTYPE:
|
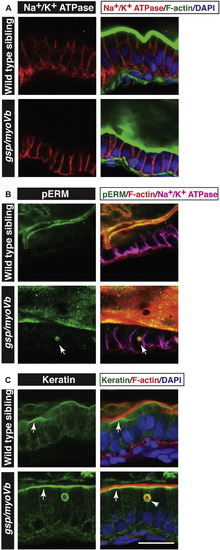
Characterisation of intestinal phenotypes using apical and basolateral markers. Immunohistology on 6 day-old wild type and gsp/myoVb gut followed by confocal microscopy to analyse localisation of Na+/K+ ATPase (A) pERM (B) and Keratin (C) along with other markers mentioned. Na+/K+ ATPase localises to the basolateral domain in wild type as well as gsp/myoVb mutant enterocytes (A). pERM (arrows in B) and Keratin (arrowhead in C) localise to inclusion bodies. Note the subapical localisation of keratin (arrows in C) in wild type as well as in gsp/myoVb gut. Scale bar = 20 μm. |
Reprinted from Mechanisms of Development, 142, Sidhaye, J., Pinto, C.S., Dharap, S., Jacob, T., Bhargava, S., Sonawane, M., The zebrafish goosepimples/myosin Vb mutant exhibits cellular attributes of human microvillus inclusion disease, 62-74, Copyright (2016) with permission from Elsevier. Full text @ Mech. Dev.