
- Title
-
Association of Early Atherosclerosis with Vascular Wall Shear Stress in Hypercholesterolemic Zebrafish
- Authors
- Lee, S.J., Choi, W., Seo, E., Yeom, E.
- Source
- Full text @ PLoS One
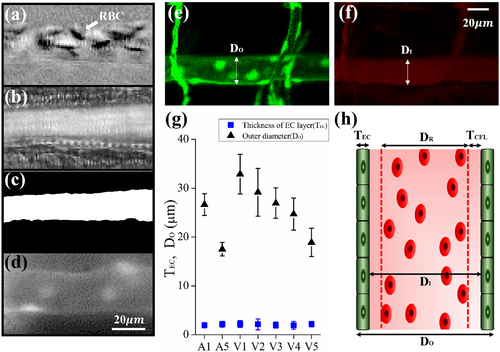
Identification of RBC-rich region and cell-free layer (CFL). (a) Bright field image of Artery 1 (A1) after subtraction of the background image. (b) Map of standard deviation (SD). (c) Binary image created by thresholding the SD map. (d) Fluorescent image of endothelial cells (ECs) on the vessel wall. Confocal microscopy image of (e) green fluorescent ECs on the vessel wall and (f) cholesteryl ester BODIPY 542/563 C11 circulating inside the blood vessel. The outer (DO) and inner (DI) diameters of the vessel were indicated by white arrows. (g) The DO and thickness of EC layer (TEC) of each vessel were compared. (h) Terminologies should express the blood vessel, TCFL (thickness of CFL) and DR (diameter of RBC-rich region). |
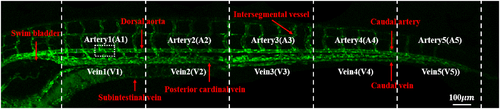
Angiogram of a zebrafish at approximately 15 days post-fertilisation (dpf). Vasculature was divided into 10 partitions by length: Arteries 1–5 (A1–5), Veins 1–5 (V1–5). |
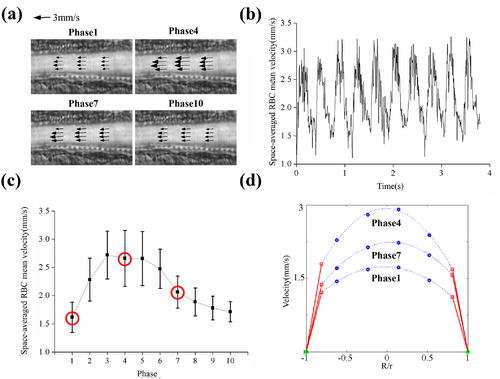
Measurement of wall shear stress in blood vessels. (a) Velocity vector fields in artery 1 (A1) at phase angles of 1, 4, 7 and 10 were overlaid with SD map. Each cardiac cycle was divided into 10 phases. (b) Temporal variation of Space-averaged RBC mean velocity (VSPACE). (c) Space-averaged RBC mean velocity (VSPACE) were averaged again in phase.(d) Velocity profiles at phases 1, 4 and 7. Red square dots: velocity magnitude of RBCs at the edge of RBC-rich region; blue dots: RBC velocity measured by μ-PIV technique; green dots: inner wall of blood vessel; blue dashed lines: fitting curve; red lines: velocity profile of plasma in CFL. |
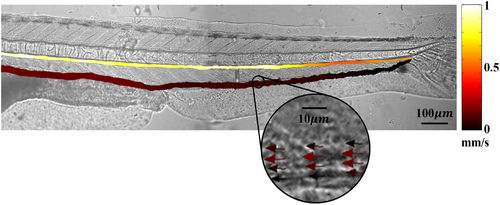
Color-coded Time-averaged RBC mean velocity (VTIME) in the main blood vessels. A selected region is enlarged to show the corresponding RBC velocity vectors. |
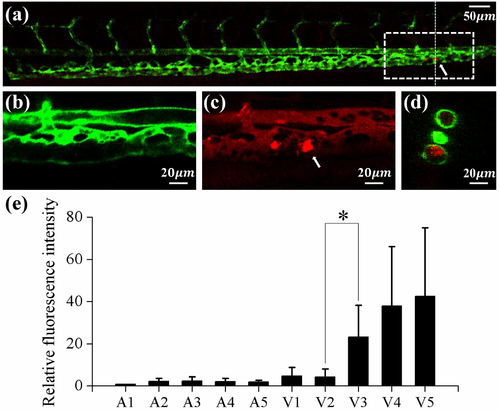
Lipid accumulation along the main blood vessel of 15 dpf zebrafish. (a) Typical confocal microscopy image of the caudal vasculature in a 15 dpf zebrafish. Bright fluorescent displays lipid deposit in the blood vessel. White arrows denote the location of lipid accumulation. ECs and fluorescent lipid image in the square dotted region were magnified in (b) and (c), respectively. (a)~(c) 2D sectional image, lateral view. (d) Cross sectional image at the vertical dotted line in (a). (e) Variation of relative fluorescence intensity of lipid in10 vessels. (n = 11) *P < 0.001. PHENOTYPE:
|
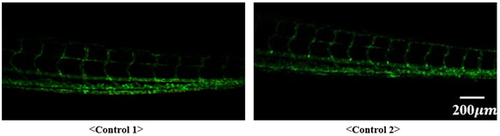
Confocal microscope images of two control zebrafish models. Control experiments using zebrafish fed normal diet for 10 days were conducted (the same amount of fluorescent cholesteryl ester without additional cholesterol). As shown in the figure below, deposition of lipids on blood vessels was not observed in the confocal microscope images of the control group. |