
|
Fig. 1
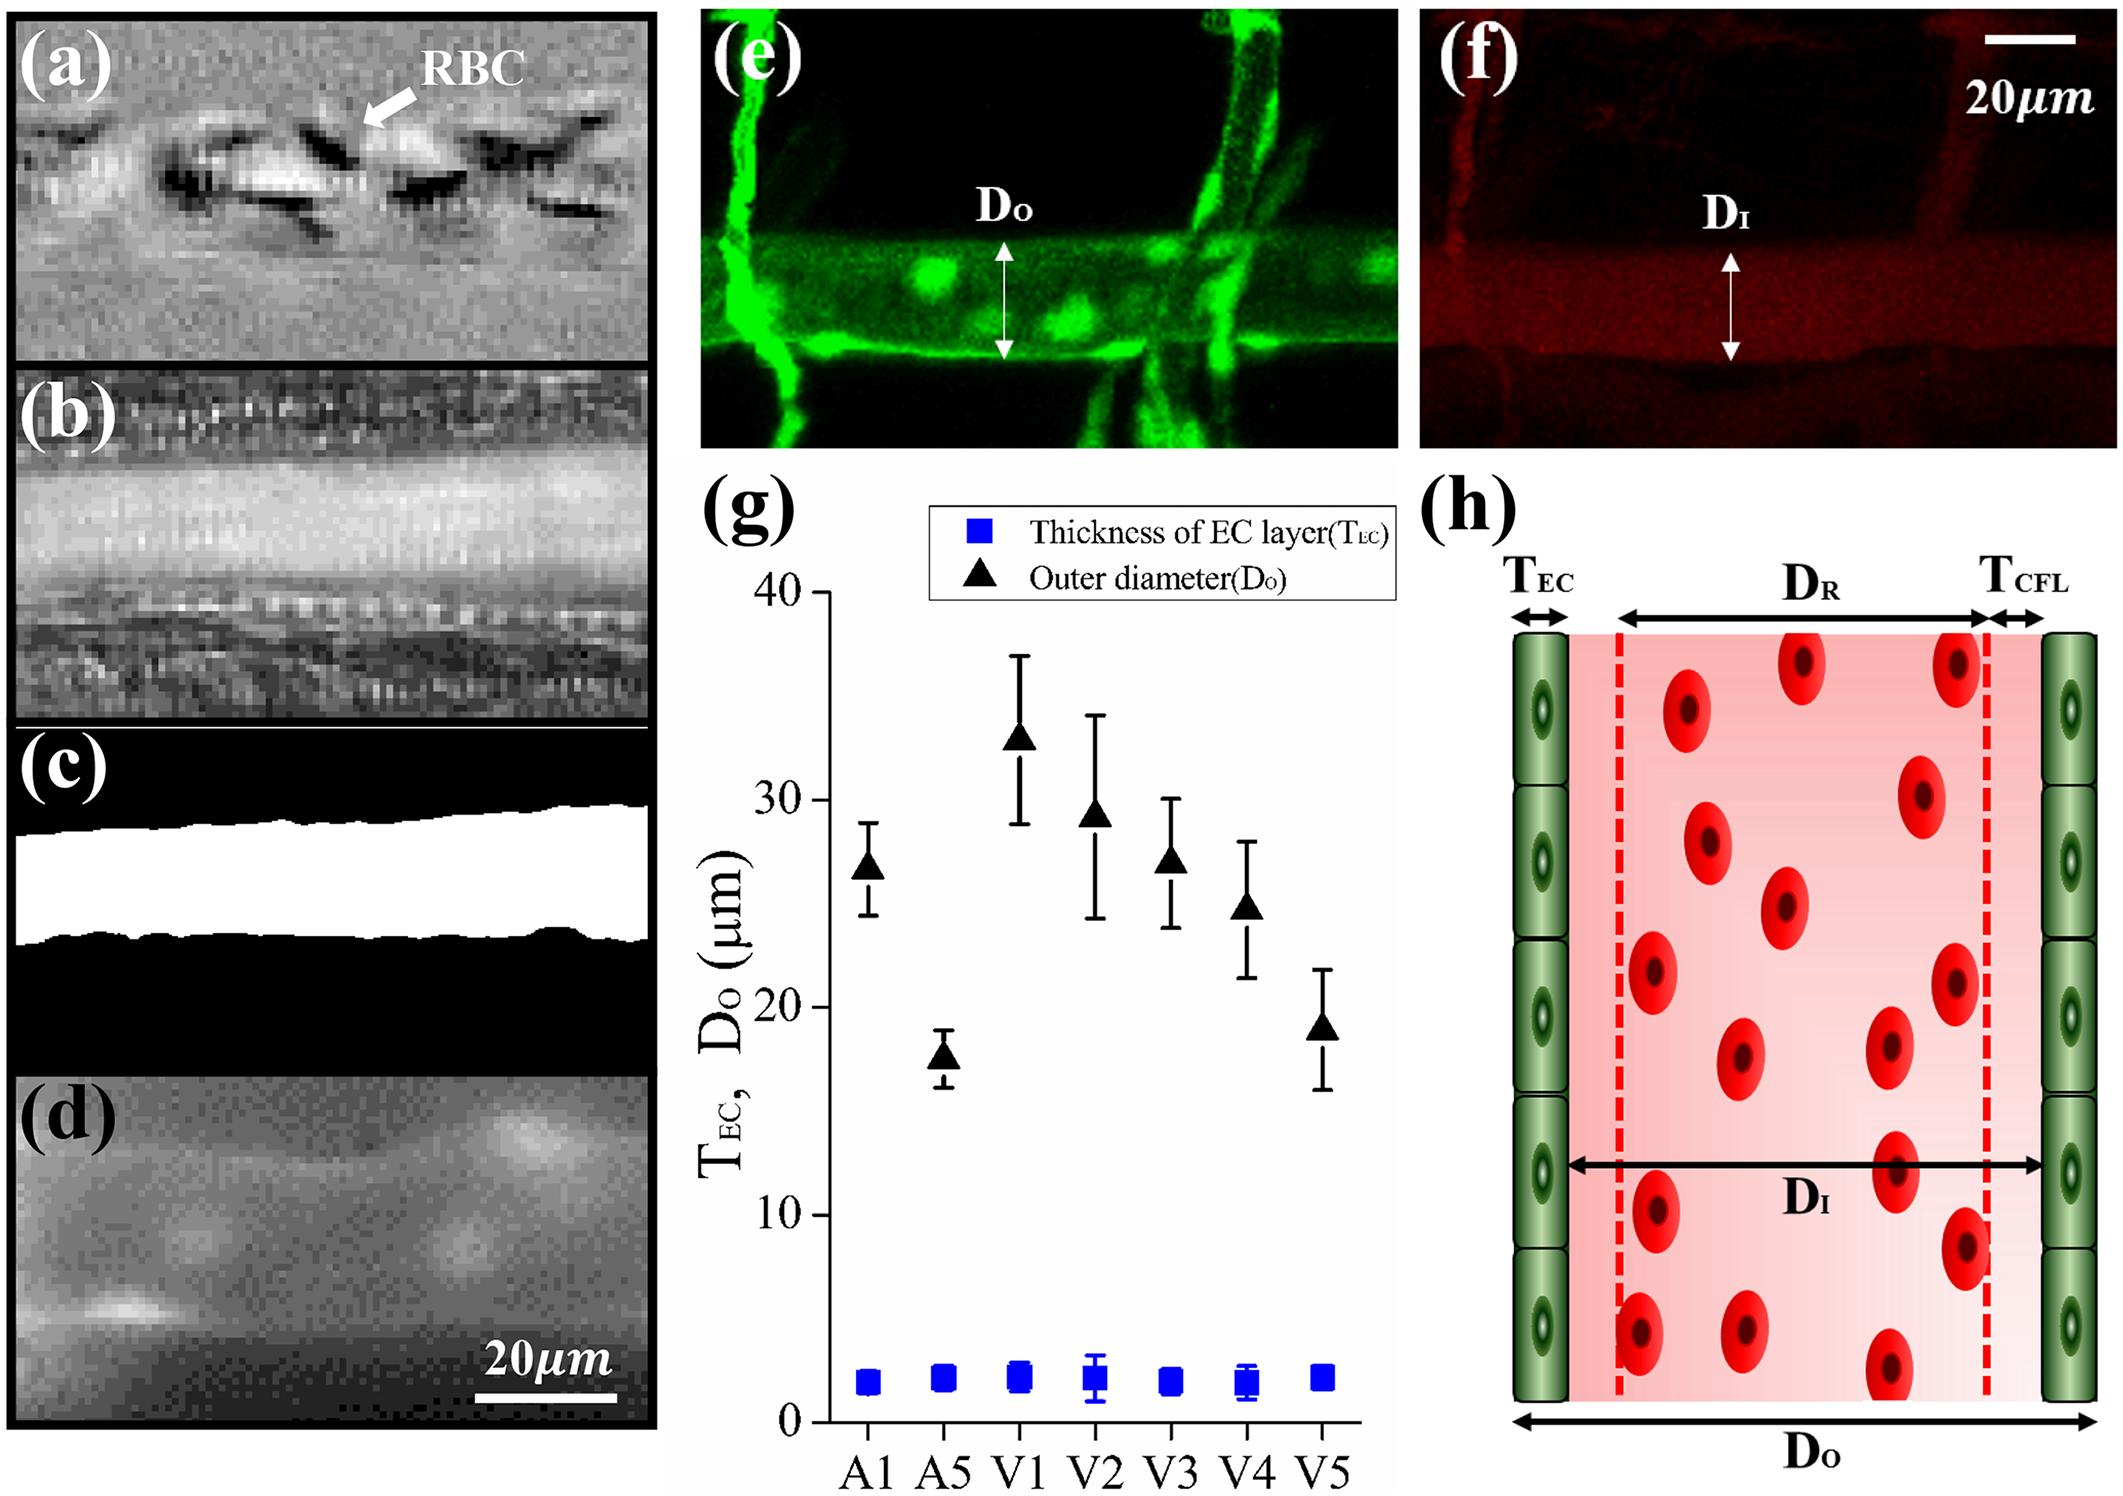
Identification of RBC-rich region and cell-free layer (CFL).
(a) Bright field image of Artery 1 (A1) after subtraction of the background image. (b) Map of standard deviation (SD). (c) Binary image created by thresholding the SD map. (d) Fluorescent image of endothelial cells (ECs) on the vessel wall. Confocal microscopy image of (e) green fluorescent ECs on the vessel wall and (f) cholesteryl ester BODIPY 542/563 C11 circulating inside the blood vessel. The outer (DO) and inner (DI) diameters of the vessel were indicated by white arrows. (g) The DO and thickness of EC layer (TEC) of each vessel were compared. (h) Terminologies should express the blood vessel, TCFL (thickness of CFL) and DR (diameter of RBC-rich region).