
Fig. 3
- ID
- ZDB-FIG-171030-36
- Publication
- Lee et al., 2015 - Association of Early Atherosclerosis with Vascular Wall Shear Stress in Hypercholesterolemic Zebrafish
- Other Figures
- All Figure Page
- Back to All Figure Page
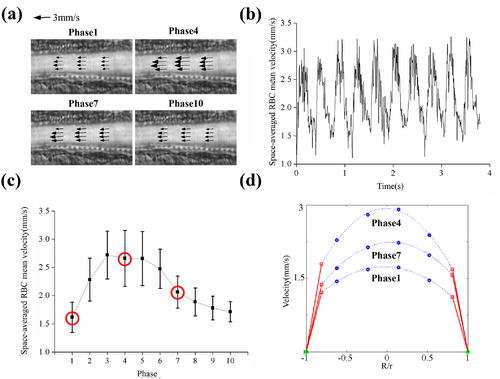
Measurement of wall shear stress in blood vessels. (a) Velocity vector fields in artery 1 (A1) at phase angles of 1, 4, 7 and 10 were overlaid with SD map. Each cardiac cycle was divided into 10 phases. (b) Temporal variation of Space-averaged RBC mean velocity (VSPACE). (c) Space-averaged RBC mean velocity (VSPACE) were averaged again in phase.(d) Velocity profiles at phases 1, 4 and 7. Red square dots: velocity magnitude of RBCs at the edge of RBC-rich region; blue dots: RBC velocity measured by μ-PIV technique; green dots: inner wall of blood vessel; blue dashed lines: fitting curve; red lines: velocity profile of plasma in CFL. |