- Title
-
Differential Requirement for irf8 in Formation of Embryonic and Adult Macrophages in Zebrafish
- Authors
- Shiau, C.E., Kaufman, Z., Meireles, A.M., Talbot, W.S.
- Source
- Full text @ PLoS One
|
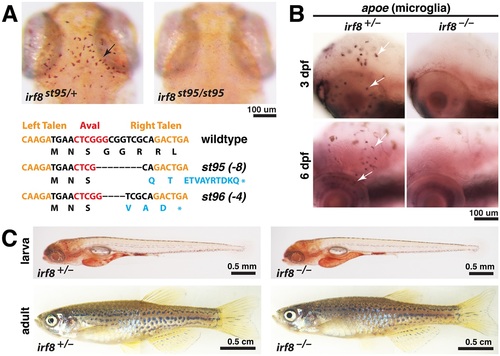
TALEN-induced irf8 mutations st95 and st96 eliminate embryonic microglia but allow survival to adulthood. (A) TALE nucleases target region near irf8 translational start site, creating frameshift mutations st95 and st96, which introduced premature stop codons as shown (bottom). Top panels show representative neutral red staining for microglia in irf8st95/st95 mutant that lacks all microglia, compared with a heterozygous sibling that has a wildtype microglial population (arrow). (B) Analysis of apoe RNA expression by in situ hybridization shows presence of microglia in irf8 sibling but no microglia in irf8 mutants at 3 and 6 dpf. (C) Images of heterozygous and homozygous mutant larvae at 5 dpf, showing that the mutants have normal overall morphology. Images of the whole adult zebrafish were compiled from two tiled images of the same fish. At 3 months of age, the irf8 mutant zebrafish grew to a similar size as its sibling. All images represent the st95 allele. Scale bars are shown below each set of panels or for each individual panel. EXPRESSION / LABELING:
PHENOTYPE:
|
|
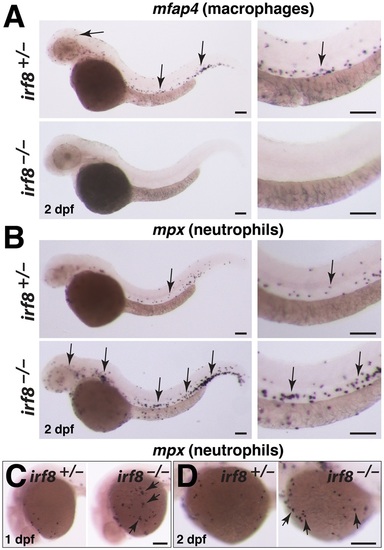
irf8 mutant embryos have no macrophages but produce excessive neutrophils. (A) mfap4 RNA expression at 2 dpf shows a complete loss of macrophages in irf8 mutant but abundant macrophages in heterozygous sibling (arrows). (B) mpx RNA expression at 2 dpf shows an overproduction of neutrophils in irf8 mutants (arrows, bottom panels) compared with the sibling (arrow, top panels). Right column in A and B shows a higher magnification image of the trunk region from the same embryos depicted in the left column. (C) Neutrophils can first be detected on the yolk sac by 1 dpf. irf8 mutants have many yolk sac neutrophils (arrows) compared with sibling. (D) At 2 dpf, irf8 mutants continue to have more neutrophils on the yolk sac (arrows). Overall, irf8 mutants appear to have more neutrophils throughout the body. All scale bars are 100 um. |
|
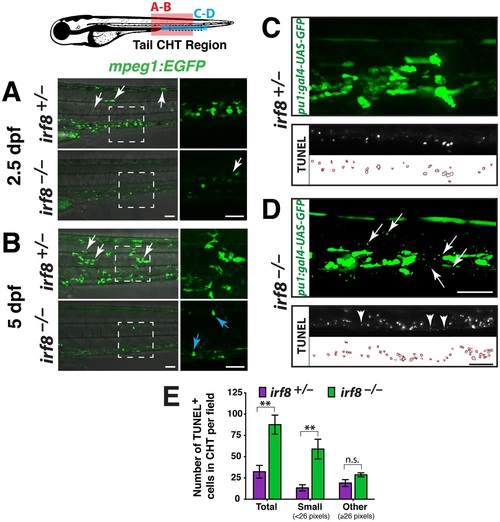
irf8 mutants have immature myeloid cells and excess myeloid cell death during development in the CHT. Diagram of a zebrafish larva showing the regions of analysis in the CHT: red box, region in A and B; blue box, region in C and D; and dotted lines in blue box indicate area of TUNEL quantification in E. (A-B) Lateral view. Right panels, higher magnification of the dotted box shown on the left. Analysis at 2.5 dpf (A) and 5 dpf (B) shows that siblings have many macrophages strongly expressing mpeg1:EGFP; these cells have elaborate processes and complex morphologies, and some have migrated into other tissues (white arrows). By contrast, irf8 mutants have cells weakly expressing mpeg1:EGFP that appear immature and different from macrophages in siblings. A few strongly expressing cells are first detected in mutants at 5 dpf (B, blue arrows), indicating recovery of a few macrophages. (C-D) Early myeloid reporter pu.1:gal4-UAS-GFP at 5 dpf shows abnormally small cellular specks restricted to the CHT in all mutants (D, arrows, n = 9/9 at 3 and 5 dpf) but not in the siblings (C, n = 5/5 at 3 and 5 dpf). Bottom, TUNEL labeling of apoptotic cells at 5 dpf. The small pu.1 reporter expressing cellular specks in the CHT are similar in size and appearance to small-sized dying cells labeled by TUNEL, which are shown in another 5 dpf stage-matched irf8 mutant larva (compare arrows in top panel with arrowheads in bottom panel from different larvae). TUNEL labeling (middle) and area traces of the TUNEL+ nuclei (bottom) are shown for each genotype. (E) Quantification of TUNEL assay as represented in C-D shows a significant increase in total dying cells in the CHT of irf8 mutants (n = 3) compared with siblings (n = 6; p = 0.0039). This is largely accounted for by a significant increase in very small-sized TUNEL+ cells measuring less than 26 pixels in area (p = 0.0017). No significant difference was found in larger TUNEL+ cells (e 26 pixels in area, p = 0.16). Error bars represent S.E.M. Statistical significance was determined by two-tailed Student’s t-test. **, p < 0.01; *, p < 0.05; n.s., not significant; CHT, caudal hematopoietic tissue. All scale bars are 50 um and are the same for each set of panels. |
|
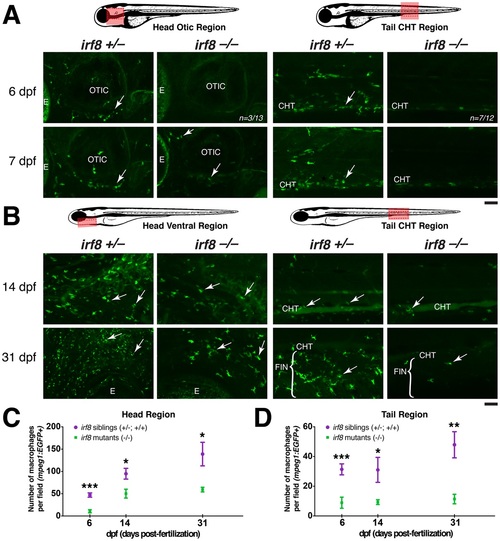
Partial recovery of macrophages in irf8 mutants begins by ~7 dpf in the head region. Diagrams of zebrafish showing region of quantification (pink box), which was taken using the same magnification and field size of view at all stages. The field of view in older stages covers a relatively smaller region of the head because the fish are larger (comparing B with A). Red dotted box shows the region of the fluorescent images. (A) Expression of macrophage reporter mpeg1:EGFP at 6 and 7 dpf. Arrows show macrophages. At 6 dpf, most irf8 mutants have no macrophages in the CHT (n = 7/12), while most have a few macrophages in the head (n = 10/13); image shows the head region of a mutant at 6 dpf with no macrophages. Panels show the tail CHT region of the irf8 mutants at 6 and 7 dpf with no macrophages; a few autofluorescent pigment cells are present after PTU treatment. (B) Distribution of macrophages expressing mpeg1:EGFP at 14 dpf and 31 dpf. Arrows point to macrophages. (C) Quantification of the number of macrophages per field in the head region over time (pink box in left diagram). (D) Quantification of the number of macrophages per field in the tail region over time (pink box in right diagram). At 6 dpf, n = 20 for siblings and n = 13 for mutants; at 14 dpf, n = 8 for siblings and n = 7 for mutants; at 31 dpf, n = 7 for siblings and n = 5 for mutants. Statistical significance was determined by two-tailed Student’s t-test. Error bars represent S.E.M. ***, p < 0.001; **, p < 0.01; *, p < 0.05; CHT, caudal hematopoietic tissue; E, eye. All scale bars are 50 um. irf8-/- in this figure represents trans-heterozygous irf8st95/st96 mutants. EXPRESSION / LABELING:
PHENOTYPE:
|
|
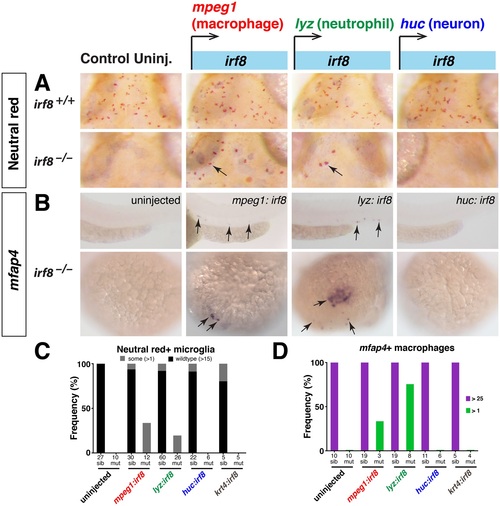
Specific expression of irf8 in macrophage or neutrophil lineage is sufficient to restore macrophage fates in irf8 mutants. (A) Neutral red staining for microglia at 4 dpf in irf8 siblings and mutants in control uninjected conditions or after tol2-mediated expression of irf8 driven by tissue specific regulatory sequences. Expression of mpeg1:irf8 or lyz:irf8 was sufficient to restore some microglia in irf8 mutants (arrows), but not expression in the neurons (huc) or skin (krt4). (B) Analysis of total macrophage population by mfap4 RNA expression at 2.5 dpf after expression of irf8 in different tissues. Specific expression of mpeg1:irf8 or lyz:irf8 was also sufficient to restore macrophages on yolk sac and embryo proper (arrows) in irf8 mutants. (C) Plot showing frequency of microglia rescue. (D) Plot showing frequency of macrophage recovery. Purple denotes >25 macrophages and green shows partial recovery of less than 25 but more than 1. Numbers below bar graphs represent n, total number of embryos analyzed. sib, irf8+/+ and irf8+/-; mut, irf8-/-. |
|
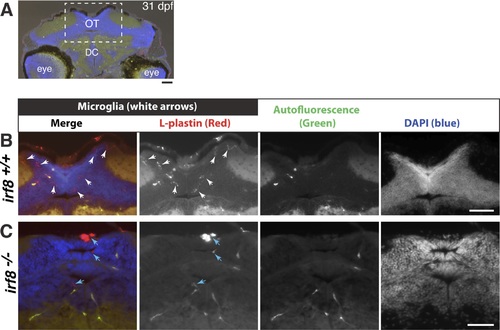
Thin brain sections reveal many microglial cells in wildtype but not in irf8 mutants, which appear to have only macrophages at 31 dpf. (A) The midbrain optic tectum, where many microglia normally reside, was the region of analysis. (B) Higher magnification of the brain region indicated in dotted box in A. 12–14 um cryosections were taken from wildtype irf8+/+ and heterozygous irf8st95/+ fish (n = 4) to compare with irf8st95/st9 mutants (n = 3) at 31 dpf. Immunostaining for L-plasin (with DAPI as a counterstain) was used to identify macrophages in relation to all cell bodies in the sections. Microglia were identified by their L-plastin expression, elaborate morphology with fine processes, and location in the parenchyma (white arrows). Cells in or adjacent to the interstitial space, vasculature, and ventricular zone were likely macrophages. Autofluorescence in the green channel helped to define the vasculature and distinguish actual L-plastin signal from vasculature autofluorescence in the red channel. irf8 mutants had a few L-plastin positive cells in the interstitial region and near the ventricular zone that lack fine processes (blue arrows), suggesting that these cells were not microglia. OT, midbrain optic tectum; DC, diencephalon. All scale bars are 50 um. |

