
- Title
-
Functional Variants in DPYSL2 Sequence Increase Schizophrenia Risk and Suggest a Link to mTOR Signaling
- Authors
- Liu, Y., Pham, X., Zhang, L., Chen, P.L., Burzynski, G., McGaughey, D.M., He, S., McGrath, J.A., Wolyniec, P., Fallin, M.D., Pierce, M.S., McCallion, A.S., Pulver, A.E., Avramopoulos, D., Valle, D.
- Source
- Full text @ G3 (Bethesda)
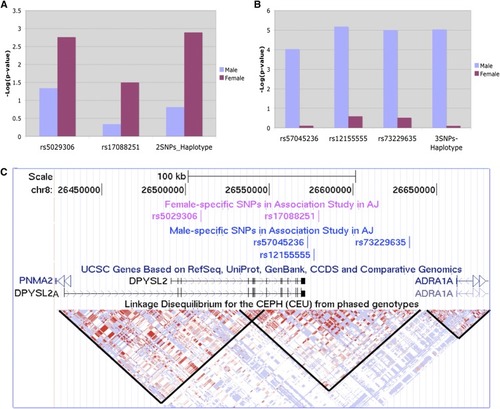
Identification of two sex-specific haplotypes with SZ susceptibility in 729 AJ SZ and 1542 AJ controls. (A) A 2-SNP (rs5029306, rs17088251) haplotype for female- specific SZ risk in AJ. (B) A 3-SNP (rs57045236, rs12155555, rs73229635) haplotype for male-specific SZ risk in AJ. (C) The same five SNPs shown in the UCSC genome browser (genome.ucsc.edu). The LD blocks, indicated by black lines, show that the SZ associated SNPs are in LD with |
|
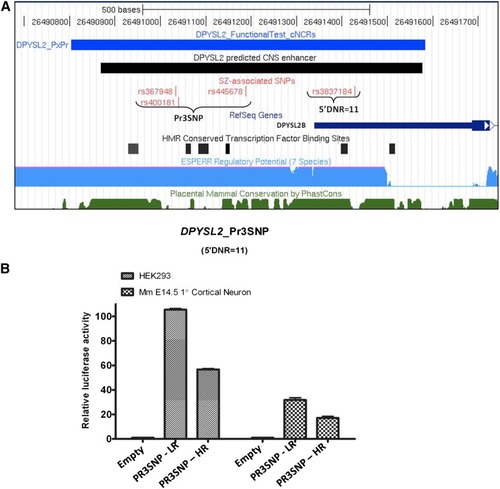
A dinucleotide repeat (DNR) in the |
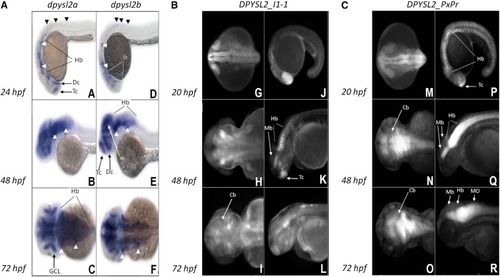
Expression pattern of ZF dpysl2 genes and DPYSL2_I1-1and DPYSL2_ShortProm elements in transgenic ZF. (A): A, B, C, D, E, F: dpysl2a and dpysl2b whole-mount |
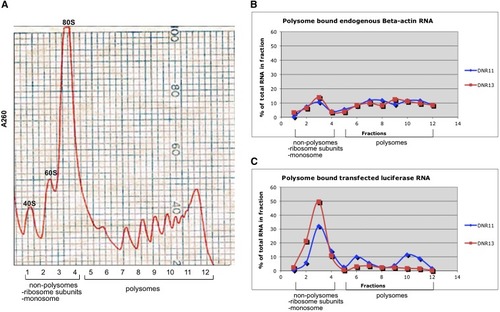
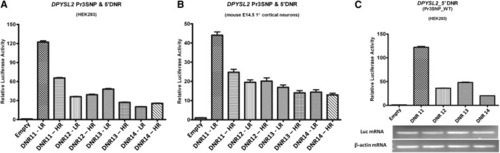
(A) Representative polysome profile of the 260-nm ultraviolet absorption through the sucrose gradient. Cytoplasmic extracts from HEK293 cells transfected with DNR luciferase constructs were layered over a 15–50% sucrose gradient. A total of 12 fractions (850 μL) were collected from the top of the gradient, and absorbance was measured at 260 nm to identify fractions containing monosomes and polysomes. Fraction 1 was devoid of any ribosomes, and fraction 2s−4 were nonpolysomes containing ribosome subunits and monosomes. Polysomes were present in fractions 5−12. (B and C) Distribution of endogenous beta-actin mRNA and exogenous luciferase mRNA in polysomes separated into 12 fractions by sucrose gradient. Blue line: cell lysates from HEK293 cells transfected with DNR 11 repeats; red line: HEK293 cell lysates from HEK293 cells transfected with DNR 13 repeats. (B) Endogenous beta-actin mRNA was found mostly on polysome fractions in both samples indicating active translation. (C) Polysome distribution of luciferase mRNA generated from transfected cells differed between DNR11 and DNR13—with more mRNA on polysomal fractions from DNR11 (47%) than DNR13 (15%). |
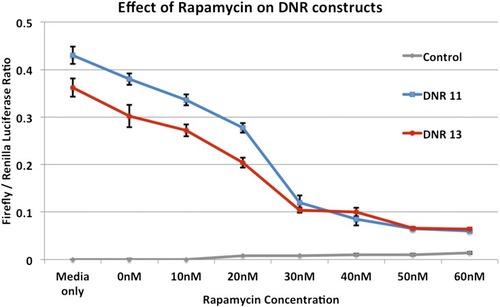
Effect of the mTOR inhibitor rapamycin on the DNR-driven expression of luciferase in HEK293 cells. The effects on the empty vector and the two 11 (WT) and 13 (Risk) DNR alleles are shown for a range of rapamycin concentrations. Rapamycin decreases luciferase activity for both alleles and reaches a plateau after ~30 nM. At this concentration the difference between the two alleles is no longer significant. |