- Title
-
Mycobacteria Counteract a TLR-Mediated Nitrosative Defense Mechanism in a Zebrafish Infection Model
- Authors
- Elks, P.M., van der Vaart, M., van Hensbergen, V., Schutz, E., Redd, M.J., Murayama, E., Spaink, H.P., Meijer, A.H.
- Source
- Full text @ PLoS One
|
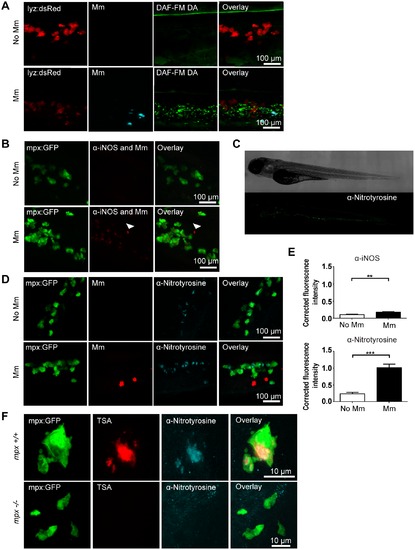
Tyrosine nitration is a quantifiable measure of nitration output during early Mm infection. (A) Confocal micrographs of DAF-FM DA stained embryos at 1 day post infection (dpi) in the caudal vein region. Neutrophils are shown by lyz driven dsRed. Upper panels show an example of an uninfected embryo while lower panels show an infected embryo. N.b. The bright stripe of DAF-FM DA staining in the upper panels is the notochord, which has variable brightness when focusing on the caudal vein region due to differences in embryo mounting. (B) Confocal micrographs of 1 dpi embryos stained with iNOS antibody (dim red) when infected with Mm (bright red, white arrow) or non-infected. Neutrophils are shown by mpx:GFP. (C) Fluorescence micrographs of confocal images stitched together to show the location of anti-nitrotyrosine staining in a whole-mount wild type zebrafish embryo of 3 dpf. (D) Confocal fluorescence micrographs of 1 dpi embryos showing the co-localization of mpx:GFP and anti-nitrotyrosine antibody staining in the absence or presence of Mm infection. (E) Corrected fluorescence intensity measurements of antibody stainings in the absence or presence of Mm. Upper panel shows the levels for the iNOS antibody shown in (B). Data shown are mean ± SEM, n = 45 cells from 15 embryos combined from 3 independent experiments. Lower panel shows the levels for the anti-nitrotyrosine antibody shown in D). Data shown are mean ± SEM, n = 58–99 cells from 15 embryos combined from 3 independent experiments. (F) Confocal micrographs showing co-localization of nitrotyrosine with compartments of neutrophils with myeloperoxidase activity (shown by TSA staining, in the absence of infection at 2 dpf. In the mpx-/- mutant there is no myeloperoxidase activity and a corresponding decrease in nitrotyrosine. EXPRESSION / LABELING:
|
|
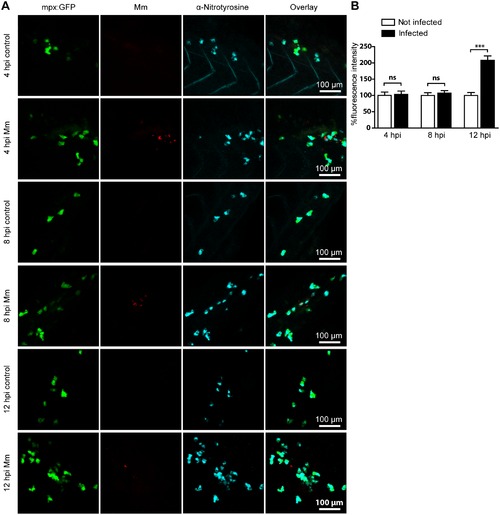
Mm infection increased tyrosine nitration levels at 12 hpi. (A) Example fluorescence confocal z-stacks of the caudal vein region of embryos stained with anti-nitrotyrosine antibody, imaged at 4, 8 or 12 hpi in the presence or absence of Mm infection. (B) Corrected fluorescence intensity levels of anti-nitrotyrosine antibody confocal z-stacks of equal size at 4, 8 or 12 hours after Mm infection relative to the control group per time point. Data shown are mean ± SEM, n = 50–85 cells from 15 embryos combined from 3 independent experiments. |
|
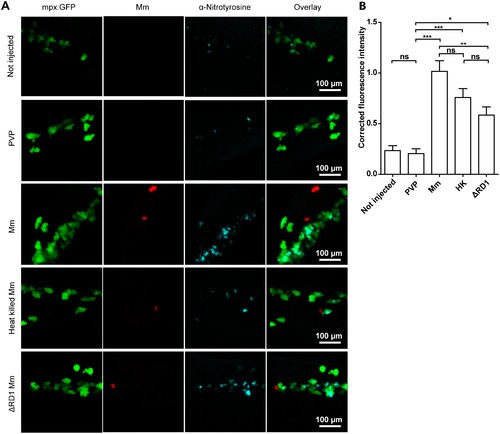
Injection with live, heat-killed or ΔRD1 Mm increased tyrosine nitration levels. (A) Example fluorescence confocal z-stacks of the caudal vein region of embryos stained with anti-nitrotyrosine antibody, imaged 1 day after injection with live, heat killed or ΔRD1 Mm in comparison with uninjected embryos or embryos injected with 2% PVP carrier solution. (B) Corrected fluorescence intensity levels of anti-nitrotyrosine antibody confocal z-stacks of equal size 1 day after injection with live, heat killed or ΔRD1 Mm. Data shown are mean ± SEM, n = 58-99 cells from 15 embryos combined from 3 independent experiments. EXPRESSION / LABELING:
|
|
Increased nitrotyrosine levels in neutrophils post-infection is independent of Il8/Cxcr2 signaling. (A) Example fluorescent confocal micrographs of the caudal vein region stained with anti-nitrotyrosine at 1 dpi, following injection of either the standard control morpholino or the il8 splice blocking morpholino at the 1-cell stage. Larvae shown are in the presence or absence of Mm, as indicated in the panels. (B) Corrected fluorescence intensity levels of anti-nitrotyrosine antibody confocal z-stacks of equal size 1 day after injection of control or il8 morpholino. Data shown are mean ± SEM, n = 90 cells from 15 embryos combined from 3 independent experiments. (C) Example fluorescent confocal micrographs of the caudal vein region stained with anti-nitrotyrosine at 1 dpi, following treatment with the Cxcr2 inhibitor SB225002 or DMSO control. Larvae shown are in the presence or absence of Mm, as indicated in the panels. (D) Corrected fluorescence intensity levels of anti-nitrotyrosine antibody confocal z-stacks of equal size 1 day after treatment of DMSO or SB225002. Data shown are mean ± SEM, n = 90 cells from 15 embryos combined from 3 independent experiments. EXPRESSION / LABELING:
|
|
Increased tyrosine nitration following Mm infection is dependent on MyD88. (A) Fluorescent micrographs of confocal images showing the overlap between mpx:GFP and anti-nitrotyrosine staining in myd88+/+ or myd88-/- embryos. (B) Example fluorescence confocal z-stacks of the caudal vein region of myd88+/+ or myd88-/- embryos stained with anti-nitrotyrosine antibody, imaged at 1 dpi in the presence or absence of Mm infection. (C) Corrected fluorescence intensity levels of anti-nitrotyrosine antibody confocal z-stacks of equal size 1 day after injection with Mm in myd88+/+ or myd88-/- embryos. Data shown are mean ± SEM, n = 30 cells from 5 embryos representative of 2 independent experiments. EXPRESSION / LABELING:
|
|
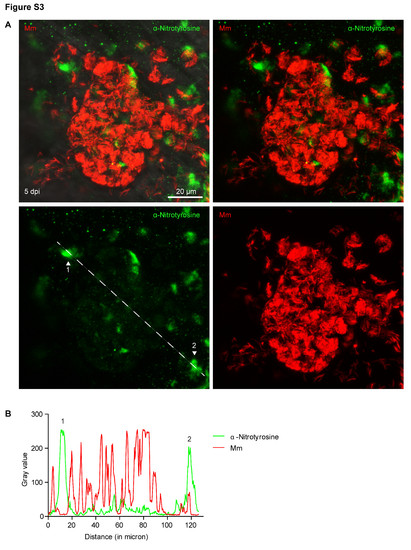
Nitrotyrosine levels are lower in the center of mycobacterial granulomas in zebrafish embryos. (A) Example fluorescence confocal micrographs of anti-nitrotyrosine staining performed on 3 dpi granuloma structures in wild type embryos infected with Mm showing a single Z-plane. (B) Gray values of the bacterial and anti-nitrotyrosine fluorescence signals measured along a straight line through the center of the granuloma along the longest axis of the granuloma (see white dashed lines in (A)), intensity of the fluorescent signal was measured using ImageJ. Numbered peaks in the graphs correspond to numbered patches of tyrosine nitration in (A). |
|
High levels of neutrophil tyrosine nitration are attenuated by live wild type orΔRD1 Mm, but not heat killed Mm. (A) Example fluorescence confocal z-stacks of the caudal vein region of dominant active hif-1α (DA1) mRNA injected embryos stained with anti-nitrotyrosine antibody, imaged 1 day after injection with live, heat killed or ΔRD1 Mm. (B) Corrected fluorescence intensity levels of anti-nitrotyrosine antibody confocal z-stacks of equal size on dominant active hif-1α (DA1) mRNA injected embryos, 1 day after injection with live, heat killed or ΔRD1 Mm. Data shown are mean ± SEM, n = 74-108 cells from 15 embryos combined from 3 independent experiments. |
|
Anti-nitrotyrosine predominantly labels neutrophils in granulomas. Example fluorescent micrographs of anti-nitrotyrosine staining performed on 4 dpi granuloma structures after infection with Mm. The staining colocalized, in the main, with the mpx:GFP fluorescence of neutrophils. Two brightly stained example cells are indicated by the white arrow heads. |
|
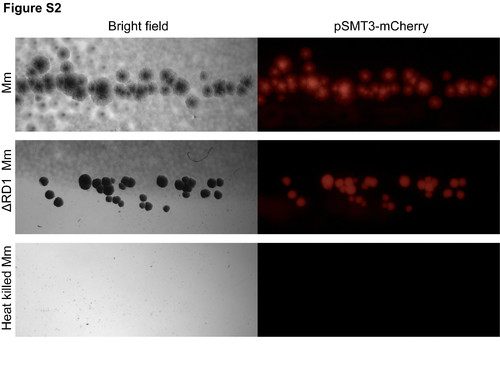
Heat killed M. marinum does not grow on plates. The injection dose of live, heat killed or ΔRD1 Mm were plated for CFU counts. Heat-killed Mm did not grow on appropriate media after incubation for a week. |
|
Nitrotyrosine levels in progression granulomas are lower when co-localized with bacteria. (A) Example fluorescence confocal micrographs of anti-nitrotyrosine staining performed on 5 dpi granuloma structures in wild type embryos infected with Mm. A merged image of extended focus is shown in the top left panel while the signal Z-plane used for the measurements is shown in the top right panel. (B) Gray values of the bacterial and anti-nitrotyrosine fluorescence signals measured along a straight line through the center of the granuloma (see white lines in (A)), intensity of the fluorescent signal was measured using ImageJ. Numbered peaks in the graphs correspond to numbered patches of tyrosine nitration in (A). |

