
IMAGE
Fig. 2
- ID
- ZDB-IMAGE-140804-13
- Genes
- Antibodies
- Publication
- Elks et al., 2014 - Mycobacteria Counteract a TLR-Mediated Nitrosative Defense Mechanism in a Zebrafish Infection Model
- All Figures
- Figures for Elks et al., 2014
Image
|
Figure Caption
Fig. 2
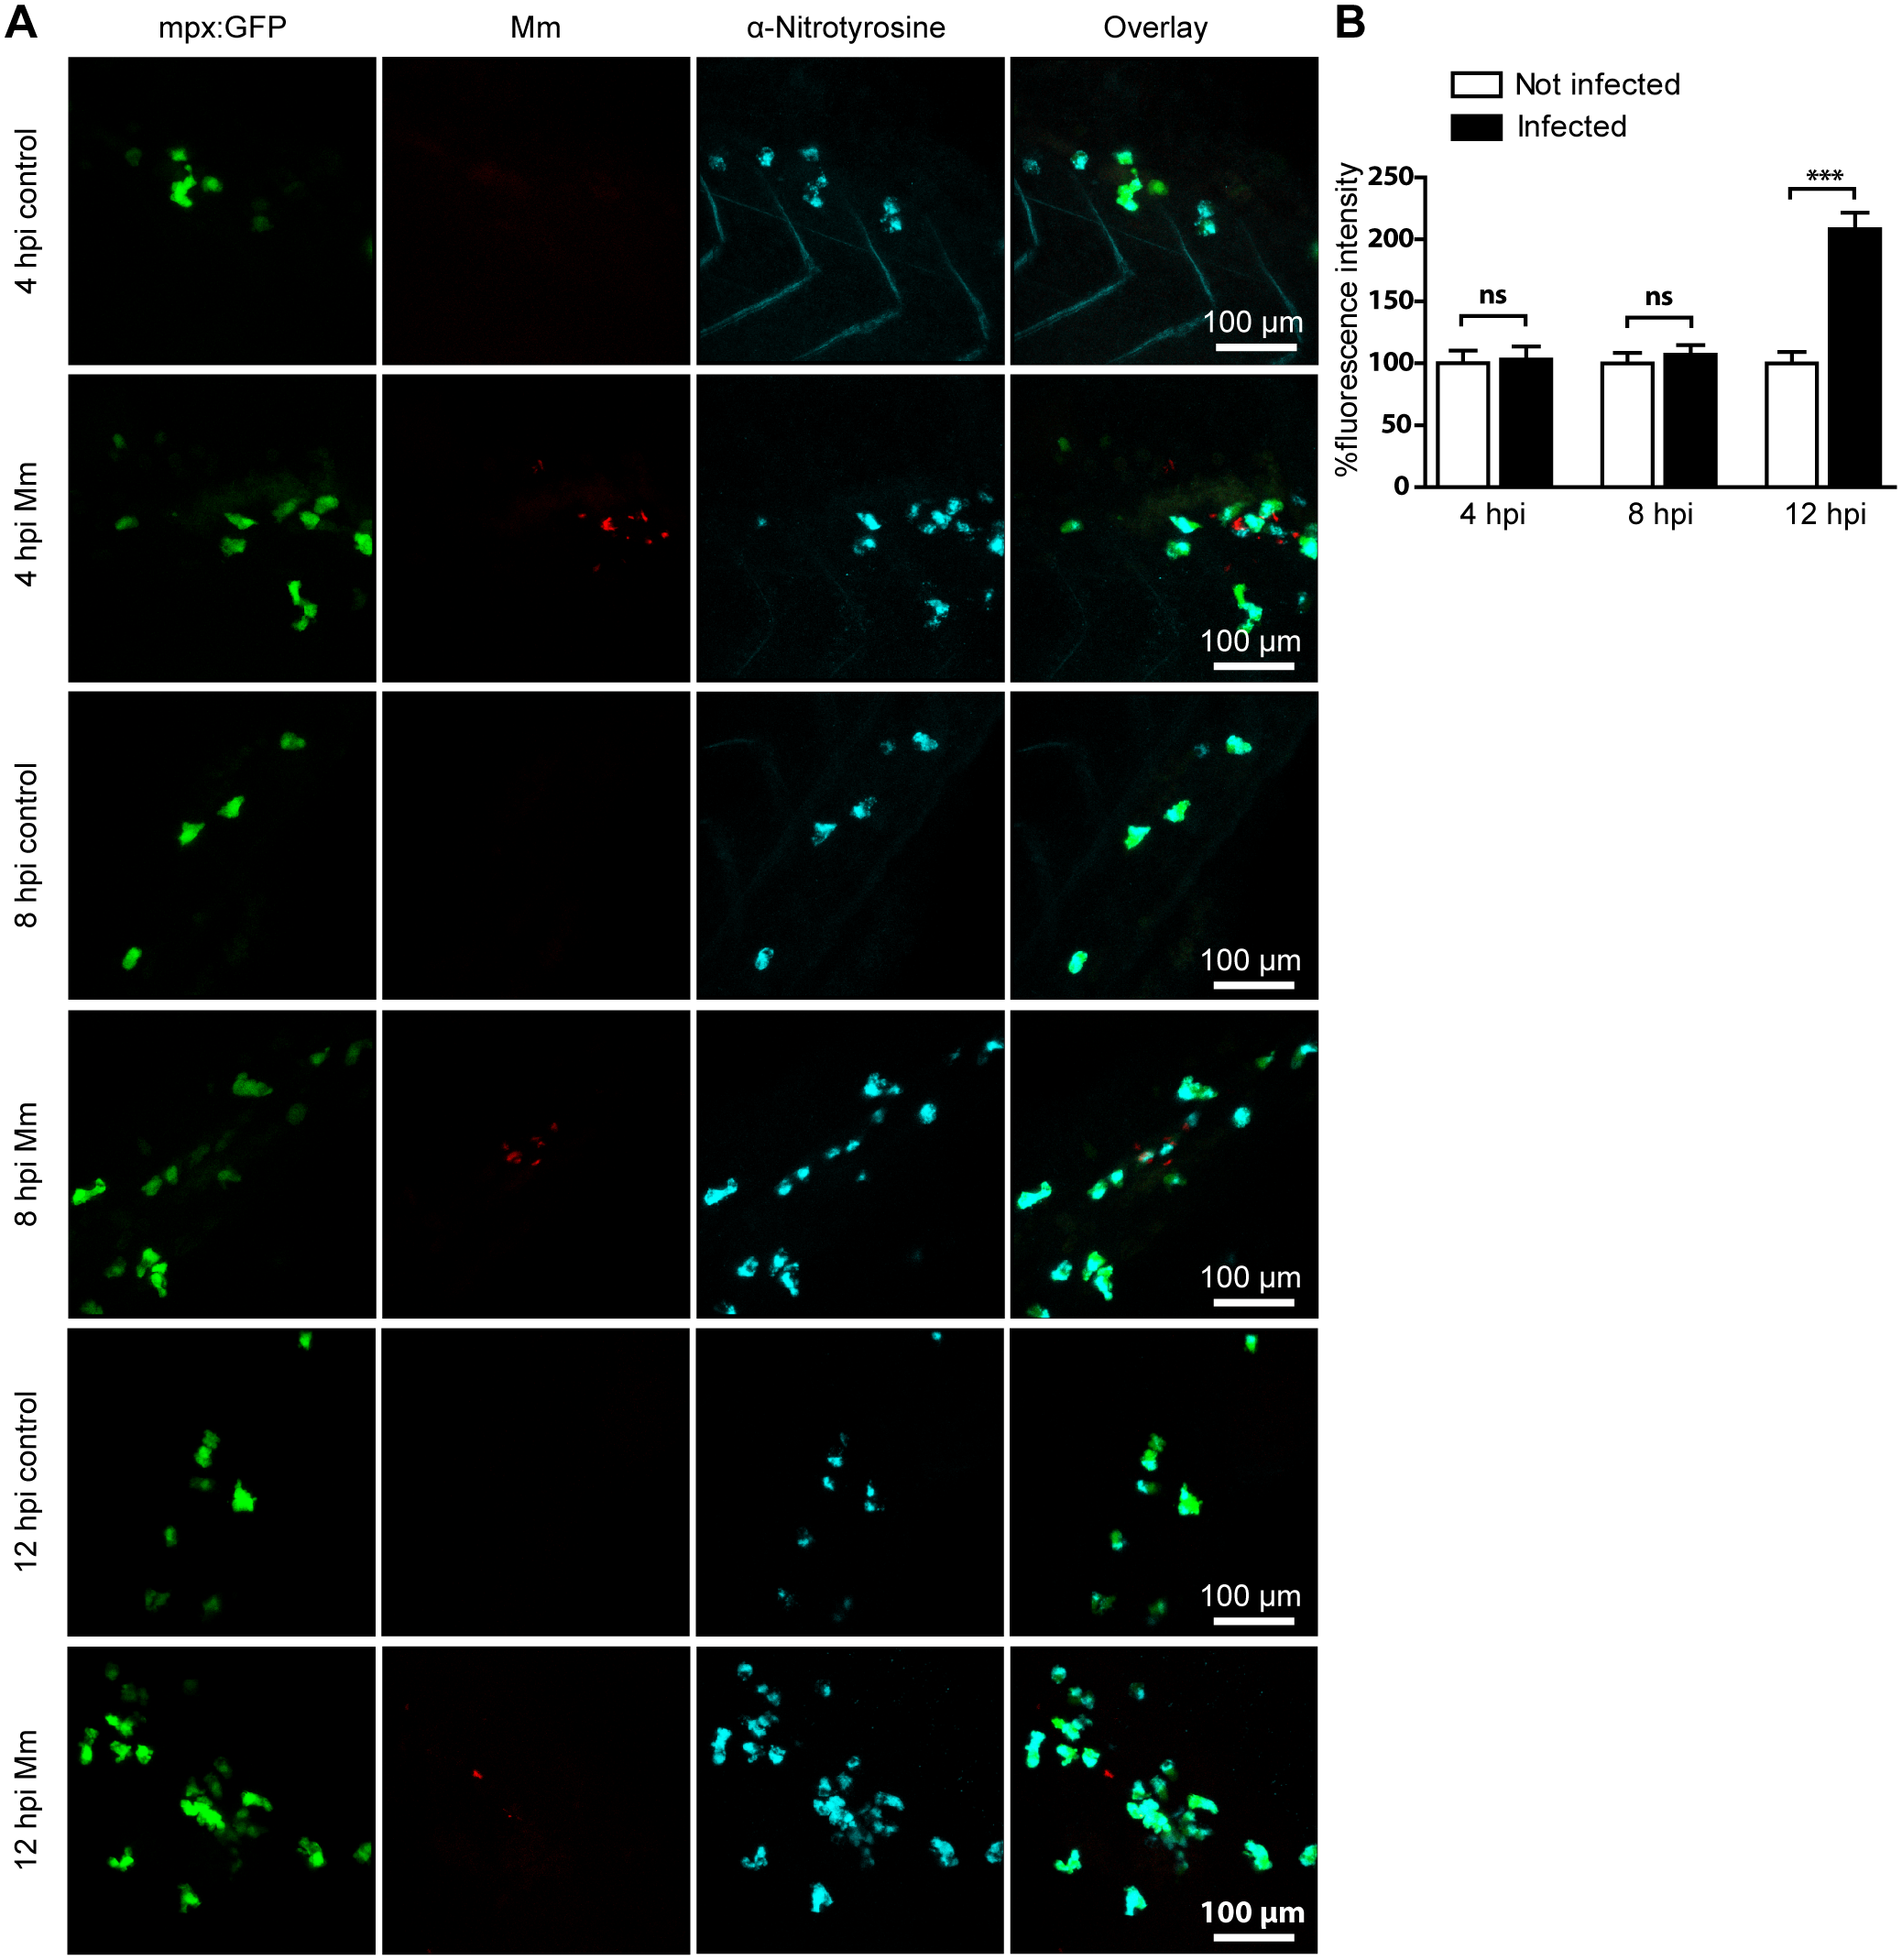
Mm infection increased tyrosine nitration levels at 12 hpi.
(A) Example fluorescence confocal z-stacks of the caudal vein region of embryos stained with anti-nitrotyrosine antibody, imaged at 4, 8 or 12 hpi in the presence or absence of Mm infection. (B) Corrected fluorescence intensity levels of anti-nitrotyrosine antibody confocal z-stacks of equal size at 4, 8 or 12 hours after Mm infection relative to the control group per time point. Data shown are mean ± SEM, n = 50–85 cells from 15 embryos combined from 3 independent experiments.
Figure Data
Acknowledgments
This image is the copyrighted work of the attributed author or publisher, and
ZFIN has permission only to display this image to its users.
Additional permissions should be obtained from the applicable author or publisher of the image.
Full text @ PLoS One