- Title
-
The HDAC Inhibitor TSA Ameliorates a Zebrafish Model of Duchenne Muscular Dystrophy
- Authors
- Johnson, N.M., Farr, G.H., and Maves, L.
- Source
- Full text @ PLoS Curr.
|
Identification of morpholino doses for zebrafish dmd knockdown. (A-C) Graphs of dmd morpholino (MO) effects. (A) Swim bladders were scored at 5 dpf. For each bar, n=3 with e25 larvae for each replicate. * P<0.04 versus control. (B) Muscle lesions were scored based on acta1a:gfp expression at 2 dpf. For each bar, n=3 with e30 larvae for each replicate. (C) Anti-Dystrophin staining was performed at 48 hpf. X-axes show ng of MO injected; c refers to controls. Anti-Dystrophin staining levels are arbitrary units. For each bar, n=2-3 with e12 larvae for each replicate. (D-I) Anti-Dystrophin staining in 48 hpf larvae. Lateral views of trunk somites show anterior to the left. Staining accumulates at myotome boundaries (Bassett et al., 2003; Guyon et al., 2003). In (C) and (I), MO1+MO6 refers to MO1 4 ng/MO6 7.5 ng combination. |
|
dmd-MO animals have a high penetrance of muscle lesions and resemble dmd mutants. (A-D) Phalloidin staining in 24 hpf embryos. Lateral views of trunk somites show anterior to the left. (E-G) Birefringence images of 4 dpf larvae. Anterior to the left. (H-I) Quantification of larval birefringence and actin labeling patterns. For each bar, n=3-6 with e11 larvae for each replicate. For each condition, P<0.0006 relative to paired control sample. All larvae from dmd crosses were genotyped. |
|
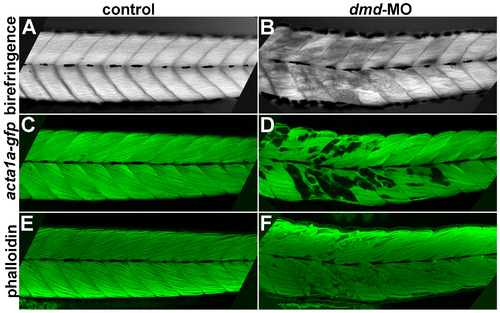
Correlation among birefringence, acta1a:gfp, and phalloidin patterns. Confocal images of a single control (A,C,E) and dmd-MO (B,D,F) larva at 4 dpf. Phalloidin staining was imaged using the red channel but false-colored in green in E,F. Lateral views of trunk somites show anterior to the left. The birefringence, acta1a-gfp, and phalloidin muscle lesion patterns strongly correlate in all larvae that were examined for all three patterns (n=8). Abnormal birefringence also correlates with lesions visualized with phalloidin staining in dmd-/- larvae (n=13, not shown). |
|
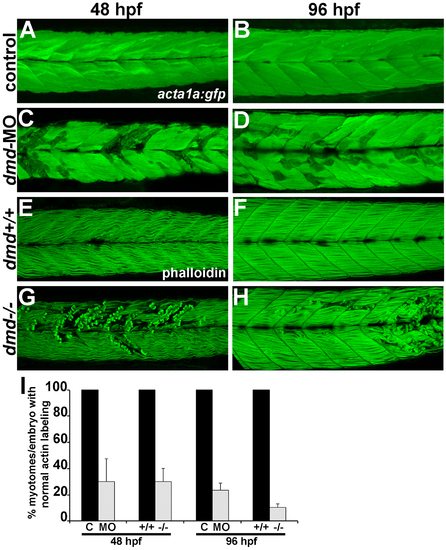
dmd-MO animals have a similar percentage of affected myotomes as dmd mutants. (A-D) acta1a:gfp expression. (E-H) phalloidin staining. Lateral views of trunk somites show anterior to the left. (I) Quantification of actin labeling patterns. For each bar at 48 hpf, n=3-6 with e 11 larvae for each replicate. For each bar at 96 hpf, n=3 with e8 larvae for each replicate. For each condition, P<0.02 relative to paired control sample. All larvae from dmd crosses were genotyped. |
|
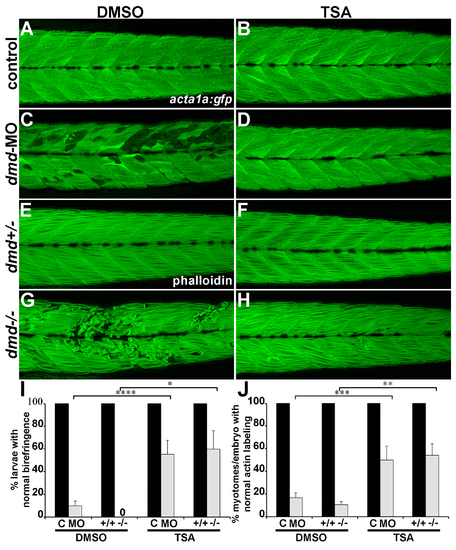
Treatment with TSA rescues dmd-MO and dmd mutant muscle lesions. (A-D) acta1a:gfpexpression. (E-H) phalloidin staining. Lateral views of trunk somites show anterior to the left. (I-J) Quantification of larval birefringence and actin labeling patterns. For control/dmd-MO treatments, for each bar, n=6 with e10 larvae for each replicate. For dmd+/+/dmd-/-treatments, for each bar, n=3 with e8 larvae for each replicate. * P<0.03. ** P<0.02. *** P<0.009. **** P<0.002. All larvae from dmd crosses were genotyped. |


