
- Title
-
Filopodia are dispensable for endothelial tip cell guidance
- Authors
- Phng, L.K., Stanchi, F., and Gerhardt, H.
- Source
- Full text @ Development
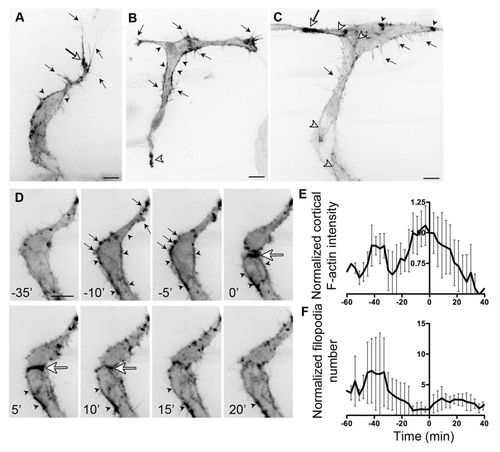
F-actin localisation in endothelial cells during angiogenesis. (A) Migrating intersomitic vessel (ISV) from a 32 hpf Tg(Fli1ep:Lifeact-EGFP) zebrafish embryo. F-actin is prominent in filopodia (black arrows), the base of filopodia (white arrow) and cell cortex (arrowheads). (B) Single-cell expression of Lifeact-EGFP in an endothelial cell (EC) spanning the ISV and dorsal longitudinal anastomotic vessel (DLAV) at 31 hpf. Cortical F-actin (black arrowhead) is present at the neck of the cell. Arrows indicate filopodia. White arrowhead points to enrichment of F-actin at the ventral end of the cell. (C) During anastomosis of ECs at the DLAV, there is enrichment of F-actin at points of contact (white arrow). F-actin is also found at cell junctions (white arrowheads), filopodia (black arrows) and in punctate structures (black arrowheads). (D) Still images of a time-lapse movie of ISV from a 31 hpf Tg(Fli1ep:Lifeact-EGFP) embryo undergoing cell division. Arrows point to F-actin-rich membrane blebs prior to cell division (-10 and -5 minutes). Arrowheads indicate accumulation of cortical actin. Strong accumulation of F-actin is observed at the contractile ring (white arrow) during cytokinesis. (E,F) Normalised cortical F-actin intensity (E) and filopodia number (F) before, during and after cell division. Raw values were normalised to the value at 0 minutes, at which two daughter cells are observed. Mean ± s.d. n=5 cells. Scale bars: 10 μm. |
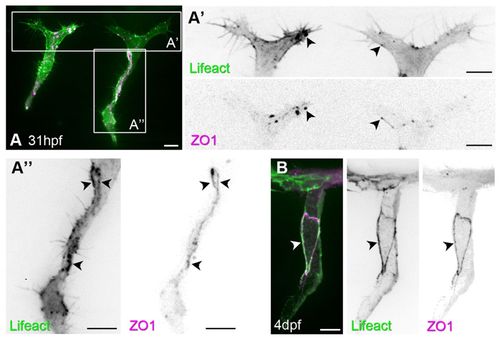
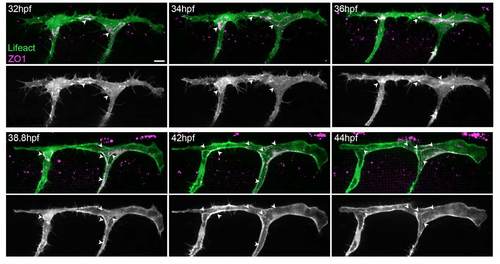
F-actin polymerises at cell junctions. (A-B) Clonal expression of Lifeact-EGFP and mCherry-ZO1 in ISVs. Arrowheads indicate colocalisation of F-actin and ZO1 in puncta (A′, single plane of endothelial tip cell) and cell junctions (A′,B). Scale bars: 10 μm. |
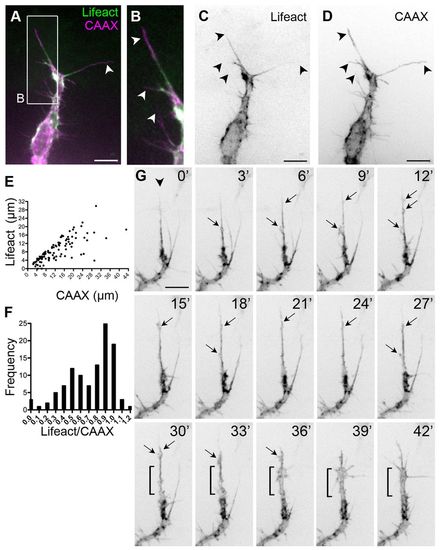
Dynamic F-actin localisation in filopodia. (A-D) Sprouting front of an ISV from a 30 hpf Tg(Fli1ep:Lifeact-EGFP); Tg(Kdr-l:ras-Cherry)s916 zebrafish embryo. Arrowheads indicate filopodia. (E) Length of the Lifeact signal in a CAAX-labelled filopodium. n=108 filopodia. (F) Frequency distribution of Lifeact/CAAX filopodia length. n=108 filopodia. (G) Dynamics of F-actin in a sprouting ISV from Tg(Fli1ep:Lifeact-EGFP) embryos. Lamellipodia-like structures (arrows) emanate from the most persistent filopodium (arrowhead) and give rise to a rapid expansion in vessel volume (from 30 to 42 minutes, bracket). Scale bars: 10 μm. |
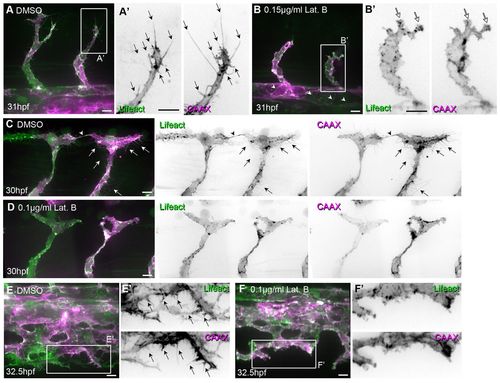
Low concentrations of Latrunculin B inhibit filopodia formation. Tg(Fli1ep:Lifeact-EGFP); Tg(Kdr-l:ras-Cherry)s916 zebrafish embryos were treated with 0.4% DMSO (control) or low concentrations of Latrunculin B (Lat. B) from (A-B′) 24 to 29 hpf, (C-D′) 26 to 29 hpf or (E-F′) 26.5 to 32 hpf. (A-B′) Arrows highlight filopodia on sprouting ISVs. White arrows indicate lamellipodia-like protrusions. Arrowheads point to junctional F-actin at dorsal aorta. (C-D′) Arrows indicate filopodia. Arrowhead highlights filopodia-based contacts between two tip cells that form the DLAV. (E-F′) Arrows indicate filopodia at vein plexus. Scale bars: 10 μm. |
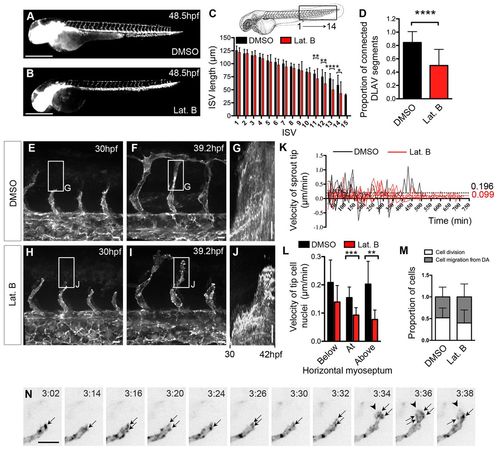
Absence of filopodia decreases migration velocity but does not affect guided migration. (A-D) Tg(Fli:GFP)y1 zebrafish embryos treated with 0.4% DMSO (A) or 0.08 μg/ml Lat. B (B) from 24 to 47.5 hpf. (C) Length of ISVs between the yolk end and tail at 48.5 hpf. DMSO, n=44 embryos; Lat. B, n=39 embryos. (D) Proportion of connected DLAV segments per embryo at 48.5 hpf. DMSO, n=43 embryos; Lat. B, n=38 embryos. (E-K) Tg(Fli1ep:Lifeact-EGFP) embryos treated with either 0.4% DMSO (E,F) or 0.1 μg/ml Lat. B (H-J) from 24 hpf and imaged from 30 hpf. (G,J) Kymographs of ISVs in E and H (boxed regions) showing migration from 30 to 42 hpf. (K) Leading edge velocity of ISVs migrating above the horizontal myoseptum. Dotted lines indicate mean velocities. Negative values indicate sprout retraction. DMSO, n=5 ISVs, n=2 embryos; 0.1 μg/ml Lat. B, n=8 ISVs, n=3 embryos. (L) Average tip cell nucleus velocity per ISV below, at and above the horizontal myoseptum of embryos treated with 0.4% DMSO or 0.1 μg/ml Lat. B. DMSO, n=7-9 nuclei, n=3 embryos; 0.1 μg/ml Lat. B, n=7-10 nuclei, n=3 embryos. (M) Proportion of ECs that arise from cell division and migration from the dorsal aorta during 13.5 hours of ISV development in DMSO-treated and 0.1 μg/ml Lat. B-treated embryos. 14-15 ISVs/treatment; three embryos/treatment. (N) Migrating front of an ISV from a Tg(Fli1ep:Lifeact-EGFP) embryo treated with 0.08 μg/ml Lat. B from 26 hpf. Arrows point to clusters of F-actin formed at the leading edge of the tip cell. Arrowheads indicate lamellipodia. Time indicates hours:minutes after addition of the drug. *P<0.05, **P<0.005, ***P<0.001, ****P<0.0001. Error bars represent s.d. Scale bars: 500 μm in A,B; 10 μm in E-J,N. |
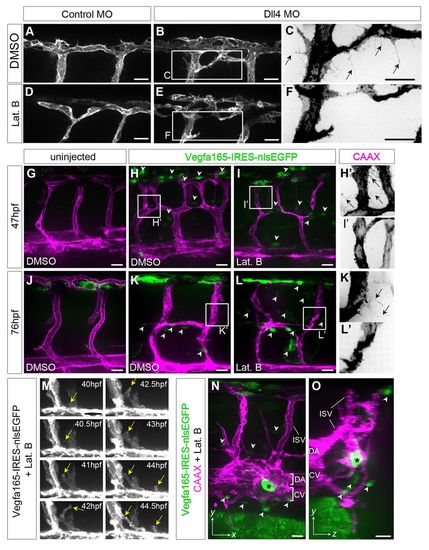
Endothelial tip cell selection and ectopic sprouting occur in the absence of filopodia. (A-F) Tg(Kdr-l:ras-Cherry)s916 zebrafish embryos injected with 15 ng control or Dll4 morpholino, treated with either 0.4% DMSO or 0.08 μg/ml Lat. B from 30 hpf and imaged at 49 hpf. (G-O) Tg(Kdr-l:ras-Cherry)s916 embryos injected with HSP:Vegfa165-IRES-nlsEGFP plasmid. (G-I′,M) Uninjected and injected embryos were heat shocked at 24 hpf, treated with 0.4% DMSO or 0.08 μg/ml Lat. B from 29 hpf, and examined at 47 hpf. (J-L′,N,O) Uninjected and injected embryos were heat shocked at 51 hpf, treated with 0.4% DMSO or 0.1 μg/ml Lat. B at 52 hpf, and examined at 76 hpf. Arrowheads indicate cells expressing nuclear EGFP and Vegfa165. Arrows highlight filopodia. Yellow arrows indicate ectopic sprout from the dorsal aorta. Asterisk indicates a cell expressing high levels of Vegfa165. DA, dorsal aorta; CV, caudal vein; ISV, intersomitic vessel. Scale bars: 20 μm. |
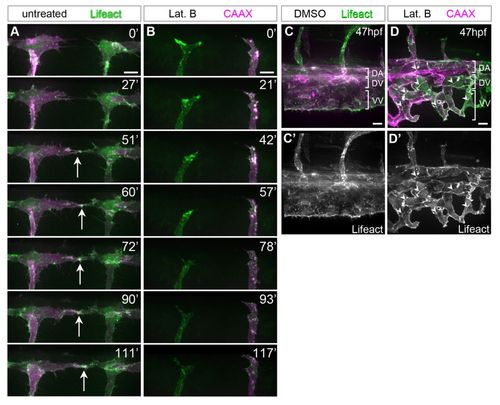
Filopodia facilitate anastomosis of DLAV and the vein plexus. (A,B) Endothelial tip cells of untreated (A) and 0.08 μg/ml Lat. B-treated (B) 31 hpf Tg(Fli1ep:Lifeact-EGFP); Tg(Kdr-l:ras-Cherry)s916 zebrafish embryos at the dorsal roof of the neural tube. Arrows indicate polymerisation of F-actin at new cell contacts. Time is in minutes. (C-D′) Vein plexi of Tg(Fli1ep:Lifeact-EGFP); Tg(Kdr-l:ras-Cherry)s916 embryos treated with DMSO or 0.1 μg/ml Lat. B from 31 to 46 hpf. Arrowheads indicate junctional F-actin. DA, dorsal aorta; DV, dorsal vein; VV, ventral vein. Scale bars: 10 μm. |
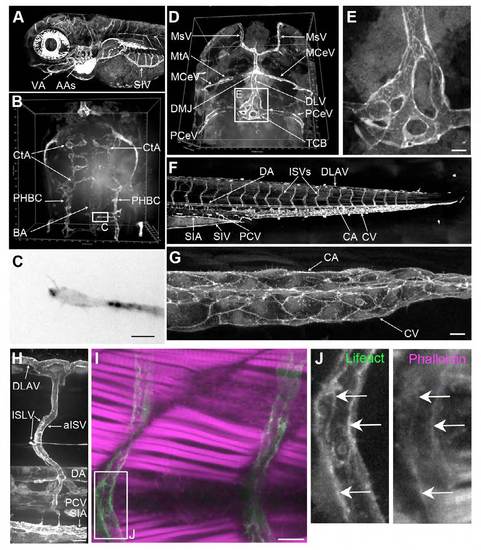
Endothelial expression of Lifeact-EGFP in Tg(Fli1ep:Lifeact-EGFP) transgenic fish. (A) Maximal projection of a confocal z-stack of the head at 3.5 dpf highlighting the subintestinal vein (SIV), aortic arches (AAs) and ventral aorta (VA). Lateral view, anterior to the left. (B) 3D projection of the developing hindbrain vasculature at 53 hpf. Dorsal view, anterior to the top. CtA, central artery; PHBC, primordial hindbrain channel; BA, basilar artery. (C) Endothelial tip cell of a vascular sprout in the boxed region in B. Scale bar: 10 μm. (D) Dorsal view of the head at 3.5 dpf. Anterior to the top. MsV, mesencephalic vein; MtA, metencephalic artery; MCeV, middle cerebral vein; DLV, dorsal longitudinal vein; DMJ, dorsal midline junction; PCeV, posterior caudal cerebral vein; TCB, trans-choroid plexus branch. (E) High magnification of the TCB from D, illustrating junctional complexity of the plexus. (F) Zebrafish trunk at 3.5 dpf. The dorsal aorta (DA), intersegmental vessels (ISVs), dorsal longitudinal anastomotic vessel (DLAV), posterior cardinal vein (PCV), caudal vein (CV), subintestinal artery (SIA) and subintestinal vein (SIV) strongly express Lifeact- EGFP. (G) High magnification of the posterior end of the caudal vein plexus at 4 dpf. Intercellular junctions are distinct in both CA and CV. Scale bar: 10 μm. (H) High magnification of DLAV, arterial ISV (aISV), intersegmental lymphatic vessel (ISLV), DA, PCV and SIA at 3 dpf. Scale bar: 20 μm. (I) ISVs from 2 dpf Tg(Fli1ep:Lifeact-EGFP) embryos stained with phalloidin (magenta). Scale bar: 10 μm. (J) High magnification of boxed region in I, showing colocalisation of Lifeact-EGFP with phalloidin in an ISV (arrows). |
Actin filaments form at cell junctions. Still images from a movie of an embryo with clonal expression of Lifeact-EGFP and mCherry-hZO1 in ISVs and DLAV. F-actin (Lifeact) is formed at ZO1-positive cell junctions (arrowheads) and undergoes similar rearrangements as ZO1 as the ISV and DLAV become lumenised. Scale bar: 10 μm. |
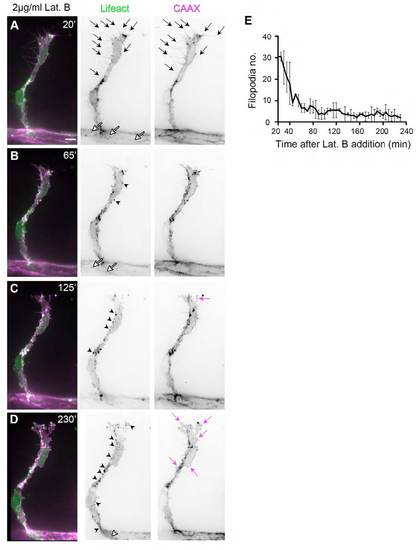
Latrunculin B disrupts F-actin polymerisation and endothelial cell morphology. Tg(Fli1ep:Lifeact-EGFP); Tg(Kdr-l:ras- Cherry) s916 28.5 hpf embryos were treated with 2 μg/ml Lat. B. (A) At 20 minutes post-addition of Lat. B, endothelial tip cells of ISVs display multiple F-actin-filled filopodia (arrows) and junctional F-actin at the dorsal aorta (white arrows). (B-D) As drug treatment continued, fewer filopodia protrusions are observed. There is an increase in F-actin-positive puncta (black arrowheads) and loss of junctional F-actin (white arrowhead in D). Concomitant to perturbation of F-actin polymerisation, there is a change in EC morphology. The cell membrane becomes more convoluted at the cell body and at cell protrusions (magenta arrows). (E) Number of CAAX-positive filopodia after addition of 2 μg/ml Lat. B. n=2 ISVs from two embryos. |
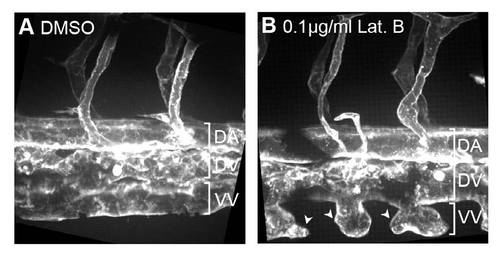
Endothelial cells of vein plexus are dependent on filopodia for anastomosis. Tg(Kdr-l:ras-Cherry)s916 embryos were treated with (A) 0.4% DMSO or (B) 0.1 μg/ml Lat. B from 22 hpf and imaged at 55 hpf. Vascular sprouts of the vein plexus become globular in morphology and fail to undergo anastomosis to form the ventral vein. DA, dorsal aorta; DV, dorsal vein; VV, ventral vein. Scale bars: 10 μm. |