- Title
-
MicroRNA-3906 Regulates Fast Muscle Differentiation through Modulating the Target Gene homer-1b in Zebrafish Embryos
- Authors
- Lin, C.Y., Chen, J.S., Loo, M.R., Hsiao, C.C., Chang, W.Y., and Tsai, H.J.
- Source
- Full text @ PLoS One
|
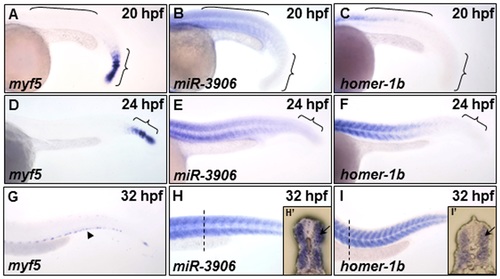
The expression patterns of myf5, miR-3906 and homer-1b in the trunk somites of zebrafish embryos. (A, D, G) Using whole-mount in situ hybridization to detect the temporal and spatial expression patterns of myf5, (B, E, H) miR-3906 and (C, F, I) homer-1b in zebrafish embryos at 20 hpf, 24 hpf and 32 hpf. At 20 hpf, (A) myf5 was expressed in the pre-somitic mesoderm and newly formed somites (indicated by { ), but it was absent in mature somites (indicated by [); (B) miR-3906 and (C) homer-1b were detected in mature somites. At 24 hpf, (D) myf5 was detected in the pre-somitic mesoderm, while (E) miR-3906 and (F) homer-1b gradually increased expression in mature somites. At 32 hpf, (G) myf5 was expressed in the edge region of trunk muscles (arrowhead), but (H) miR-3906 and (I) homer-1b were expressed in all trunk muscles. Cross section (dotted lines) showed that (F′) miR-3906 and (I′) homer-1b were expressed in fast muscle (arrows). EXPRESSION / LABELING:
|
|
Change of miR-3906 level affected the amount of homer-1b mRNA in zebrafish embryos. (A, D) Compared with WT, injection of miR-3906-MO increased the expression level of homer-1b mRNA in embryos at 24 hpf (A vs. B) and 32 hpf (D vs. E). Injection of miR-3906 dsR (mature double-strand miR-3906) reduced the expression level of homer-1b mRNA in the front of trunk muscle and was absent in the tail region at 24 hpf (A vs. C) and 32-hpf (D vs. F). (G) The expression levels of homer-1b in WT embryos, miR-3906-MO-injected embryos and miR-3906 dsR-injected embryos at 24 hpf and 32 hpf were quantified. Each one was carried out with 100 embryos, and triplicate experiments were performed (n = 3). The numbers shown in the lower-right corner of panels A-F indicate the number of phenotypes out of the total number of embryos examined. SigmaPlot software was used to perform Student’s t-test. *: indicates the difference at P<0.05 level; **: indicates the difference at P<0.01 level. |
|
Defective phenotypes induced by injection of excessive miR-3906 and homer-1b-MO were similar. (A-I) Embryos derived from transgenic line Tg (±-actin:RFP), in which red fluorescence protein (RFP) is expressed specifically in skeletal muscles, were injected with miR-3906-MO, miR-3906 dsR (mature double- strand miR-3906), homer-1b-MO or homer-1b mRNA, as indicated. After injection, the development of trunk muscle was observed at 32 hpf. Compared with WT (A), the morphological trait of embryos injected with either miR-3906-MO (B) or homer-1b mRNA (C) was similar to that of WT. Embryos injected with homer-1b-MO (D-F) and exogenous miR-3906 (miR-3906 dsR) (G-I) displayed such defective phenotypes as body axis bending and trunk muscle shortening in tail. Based on the definition of three defective levels of muscle (see Materials and Methods), we calculated the defective percentages of embryos injected with homer-1b-MO alone (J) and homer-1b-MO plus wobble homer-1b mRNA (K). The occurrence percentages of severe and mild defects of embryos injected with 1.15 ng miR-3906 dsR alone, 1.15 ng miR-3906 dsR plus 3 ng homer-1b-MO and 1.15 ng miR-3906 dsR plus 400 pg homer-1b mRNA were calculated (L). n: indicates the total number of embryos after three injections. (M) Western blot analysis of Homer-1b (48 kD, arrow) in WT (lanes 1 and 4), 3 ng homer-1b-MO-injected embryos (lane 2), 8 ng miR-3906-MO-injected embryos (lane 3) and 1.15 ng miR-3906 dsR-injected embryos (lane 5). Detection of ±-tubulin served as internal control (arrowhead). The relative intensity of Homer-1b protein among WT, homer-1b-MO, miR-3906-MO and miR-3906 dsR was also indicated. |
|
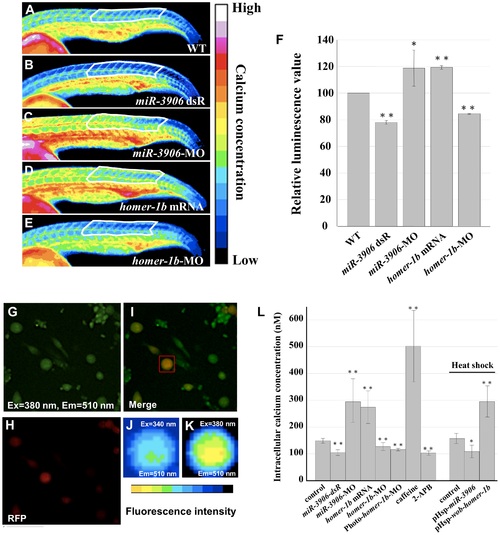
Injection of either homer1b-mRNA or miR-3906-MO increases the calcium concentration within muscle cells. (A) One-cell embryos were injected with buffer (A, as a control group WT), (B) miR-3906 dsR (1.15 ng), (C) miR-3906-MO (8 ng), (D) homer-1b mRNA (400 pg) or (E) homer-1b-MO (3 ng) with calcium green-1 and tetramethylrhodamine (as an internal control). The gradient distribution of Ca2+ concentration within the muscle cells in somites was analyzed at 24 hpf by ImageJ software analysis. There were 16 colors of signal images displaying the different intracellular Ca2+ concentrations from low to high. We sketched a fixed region comprised of 11 to 20 trunk somites, as indicated, to calculate the readings from excitation emission (the region was indicated by white line). (F) After normalization, the reading from the WT group was set as 100, and the readings of miR-3906 dsR-injected, miR-3906-MO-injected, homer-1b-mRNA-injected and homer-1b-MO-injected groups were compared. (G) The primary culture cells were stained with Fura2-AM, excited with 380 nm light, with emission at 510 nm. (H) The primary culture cells which displayed red fluorescence were the fast muscle cells. (I) The merge picture of F and G. Cells which had overlapping signals denoted in yellow were selected as detection samples (indicated by red box). (J) The image of fluorescence intensity shown on fast muscle cells that were excited by 340 nm, with emission at 510 nm. (K) The image of fluorescence intensity shown on fast muscle cells that were excited by 380 nm, with emission at 510 nm. (L) The value of [Ca2+]i was calculated by following the formula established by Grynkiewicz et al. [31] (see Materials and Methods). The values of [Ca2+]i were obtained from cells derived from WT, miR-3906 dsR-injected, miR-3906-MO-injected, homer-1b-mRNA-injected, homer-1b-MO-injected, Photo-homer-1b-MO-injected, caffeine-soaked and 2-APB-soaked embryos, followed by heat-shocked WT, pHsp-miR-3906-injected and pHsp-wob-homer-1b-injected embryos. SigmaPlot software was used to perform Student’s t-test. *: indicates the difference at P<0.05 level; **: indicates the difference at P<0.01 level. Ex: excitation; Em: emission. PHENOTYPE:
|
|
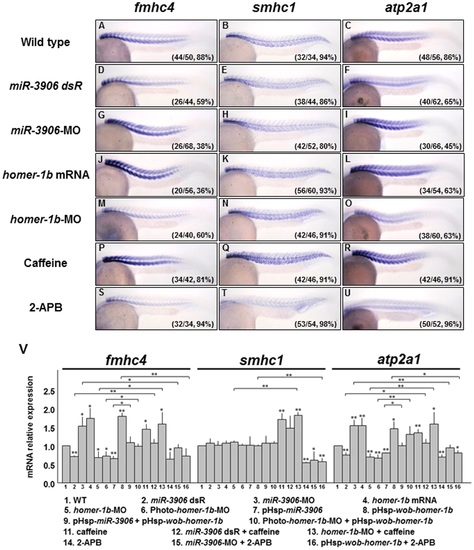
Injection of either miR-3906-MO or homer-1b mRNA affects fast muscle differentiation by regulating the calcium concentration in muscle cells. (A-C) Wild-type (WT) zebrafish embryos at 24 hpf and embryos injected with (D-F) miR-3906 dsR (1.5 ng), (G-I) miR-3906-MO (8 ng), (J-L) homer-1b mRNA (400 pg), and (M-O) homer-1b-MO (3 ng) were collected, and the expressions of fast muscle type fmhc4, slow muscle type smhc1, and calcium-sensitive gene atp2a1 were detected by WISH. (P-R) Embryos soaked with caffeine served as a positive control, indicating that [Ca2+]i was increased. (S-U) Embryos soaked with 2-APB served as a negative control, indicating that [Ca2+]i was reduced. Compared to WT (A), the expression of fmhc4 in the embryos injected with miR-3906-MO (G), homer-1b-mRNA (J) and soaked in caffeine (P) was increased. The expression of fmhc4 in the embryos injected with miR-3906 dsR (D), homer-1b-MO (M) and soaked in 2-APB (S) was decreased. The expressions of smhc1 in the embryos injected with miR-3906 and homer-1b showed no difference (B, E, H and K), while smhc1 expression was increased in embryos soaked in caffeine (Q) and reduced in embryos soaked in 2-APB (T). The expression patterns of atp2a1 (F, I, L, O, R and U) in the examined embryos displayed a result similar to that of fmhc4. (V) The expression levels of the examined genes were quantified by q-PCR analysis after embryos were treated as indicated. Three rescue experiments were included: co-injection of pHsp-wob-homer-1b (lanes 9 and 10), soaking with caffeine (lanes 12 and 13) and incubating with 2-APB (lanes 15 and 16). SigmaPlot software was used to perform the Student’s t-test. *: indicates the difference at P<0.05 level; **: indicates the difference at P<0.01 level. The numbers shown in the lower-right corner of panels A-U indicate the number of phenotypes out of the total number of embryos examined. EXPRESSION / LABELING:
|
|
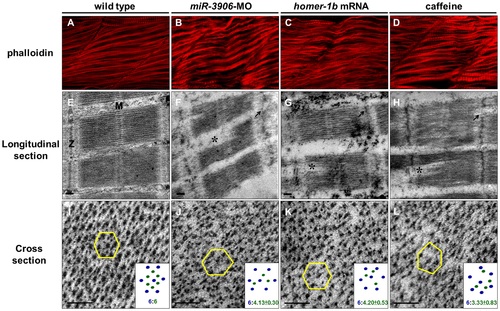
Either inhibition of miR-3906 or overexpression of homer-1b disrupts sarcomeric actin organization. Using phalloidin stain, compared to (A) WT embryos, (B) miR-3906-MO-injected embryos, (C) homer-1b-mRNA-injected embryos and (D) caffeine-soaked embryos exhibited a bending and disruption of sarcomeric actin organization in muscle cells. In longitudinal section, compared to (E) WT control embryos, (F) the Z-disc structure displaying in miR-3906-MO-injected embryos, (G) homer-1b-mRNA-injected embryos and (H) caffeine-soaked embryos was chaotic (indicated by arrows), and the full-length sarcomeres in muscle fibers were interrupted (indicated by asterisks) and could not be seen completely in a full sarcomere line. In cross section, compared to (I) WT control embryos, the relative position and proportion between myosin heavy chain and actin filament among the (J) miR-3906-MO-injected embryos, (K) homer-1b-mRNA-injected embryos and (L) caffeine-soaked embryos were chaotic and extremely irregular. For each sample, we randomly selected five positions to identify their hexagonal arrangements and calculated the ratio between the thick and thin filaments (n = 3). Results were presented at the bottom right of each picture (I-L). M:M line;Z:Z-disc;scale bar:0.1 µm. PHENOTYPE:
|

ZFIN is incorporating published figure images and captions as part of an ongoing project. Figures from some publications have not yet been curated, or are not available for display because of copyright restrictions. PHENOTYPE:
|
|
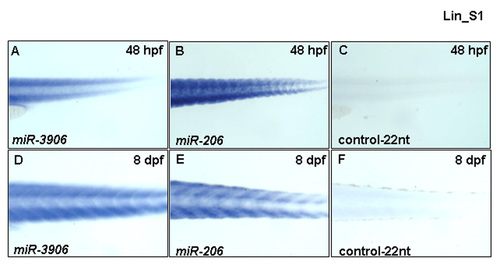
miR-3906 persisted in the trunk muscle of zebrafish embryos at later developmental stages. (A, D) Using WISH to detect the expression of miR-3906, (B, E) miR-206 and (C, F) myf5 intron1 control-22nt of zebrafish embryos at 48 hpf and 8 dpf. (A) miR-3906 was detected both at 48 hpf and (D) 8 dpf in the trunk muscles of zebrafish embryos. (B, E) Detecting miR-206 expression served as a positive control, (C, F) while detecting the expression of myf5 intron1 control-22nt served as negative control. |
|
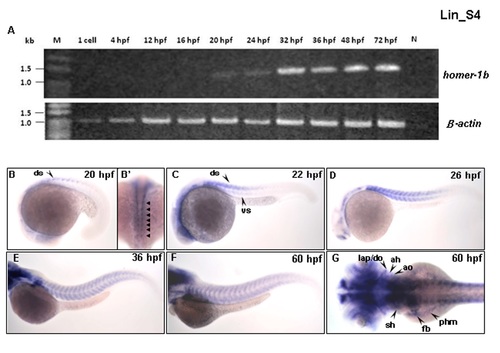
The expression patterns of homer-1b mRNA at various developmental stages. (A) Using reverse transcription-PCR to detect homer-1b transcripts in embryos at various stages as indicated. The homer1b cDNA was detected from 20 hpf until at least 72 hpf. No homer-1b primers were added to serve as negative control. Detection of β-actin cDNA served a positive control. Using whole mount in situ hybridization to detect the expression patterns of homer-1b mRNA in the muscle region of zebrafish embryos at indicated stages. (B-F) were lateral view and (B′, G) were dorsal view. The homer-1b was starting to express at the dorsal somite (ds) in the front of mature somites at 20 hpf (B, B′, arrow). At 22 hpf, homer-1b was detected at dorsal region (dorsal somite, ds) and ventral region (ventral somite, vs) in the front of mature somites (C, arrow). At 26 hpf, homer-1b expression was increased in the newly formed somites in tail (D). At 36 hpf, homer-1b transcripts were detected in trunk muscles (E, F). (G) At 60 hpf, homer-1b was also expressed in the trunk migratory muscles of fin bud (fb), posterior hypoaxial muscle (phm) and sternohyoideus (sh), as well as craniofacial muscles of adductor hyoideus (ah), adductor operculi (ao), dilator operculi (do) and levator arcus palatini (lap). EXPRESSION / LABELING:
|

