
- Title
-
Pomalidomide is nonteratogenic in chicken and zebrafish embryos and nonneurotoxic in vitro
- Authors
- Mahony, C., Erskine, L., Niven, J., Greig, N.H., Figg, W.D., and Vargesson, N.
- Source
- Full text @ Proc. Natl. Acad. Sci. USA

Identification of potent anti-inflammatory concentrations, in embryological assays, of Thalidomide, Lenalidomide, and Pomalidomide. Following tail fin transsection (line in tail fin in A), Tg(MPO::EGFP)114 zebrafish (72 hpf) were incubated with DMSO/compound. (B and C) Embryos were imaged 24 h after operation. (C) Fin cut with DMSO incubation showed cell migration to the wound site. (D–F) Thalidomide (Thal), Lenalidomide (Len), and Pomalidomide (Pom) reduce the number of migrating cells. (G) Graphical representation of the number of migrating cells following drug incubation; note Thalidomide and Lenalidomide require a higher concentration to induce the same response as Pomalidomide. (H) In vitro quantification of TNF-α production, from LPS-stimulated RAW 264.7 cells, by ELISA. Dotted line marks the maximal level of TNF-α reduction by Pomalidomide, which is not reached by Lenalidomide and Thalidomide until 200 and 250 μg/mL (772 and 968μM) respectively. (I) Cell viability, measured using trypan blue and acid phosphatase, was not altered. (J) The qRT-PCR showed a significant decrease in COX2 expression following Thalidomide, Lenalidomide, and Pomalidomide treatment. Graphs represent mean ± SEM. Statistics: (H) statistical significance was analyzed using Student’s t test. (I and J) Statistical significance was analyzed using one-way ANOVA with Tukey’s post hoc test; *P < 0.05; **P < 0.005; ***P < 0.0005, ****P < 0.0001; NS (not significant), P > 0.05. (Scale bars: 100 μm.) |
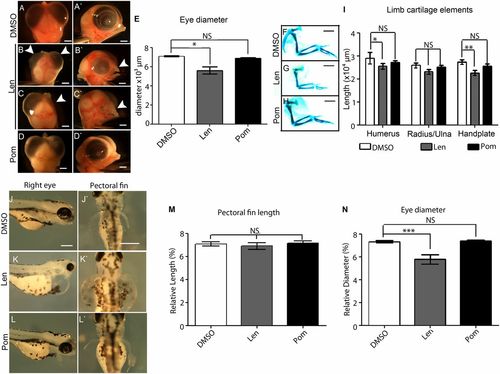
Teratogenic action of Lenalidomide and Pomalidomide at potent, anti-inflammatory concentrations. Chicken embryos were treated at HH St17-19, incubated and then fixed at E9. Head, eye, and limb growth was analyzed. (A–A2) Control head region following DMSO treatment. (B–C2) Lenalidomide 200 µg/mL (772 μM) treatment results in severe head defects, particularly beak (B–C2) and eye defects (C2). (D–D2) Pomalidomide 60 μg/mL (219 μM) does not affect head development. (E) Eye diameter is unchanged following DMSO, and Pomalidomide treatment, but is decreased following Lenalidomide treatment. (F–H) Cartilage stains 6 d after drug application. (I) Limb element length quantification. Pomalidomide treated limbs are unaffected. Zebrafish embryos were incubated with compound/DMSO at 24 hpf, and then imaged at 96 hpf. Fins, eyes, and otic vesicles were measured. (J–J2) DMSO control embryos. (K–K2) Lenalidomide-treated embryos. (L–L2) Pomalidomide-treated embryos. (M–N) Quantification of cartilage structures. Statistical significance was analyzed using one-way ANOVA with Tukey’s post hoc test. (J–L2). Graphs represent mean ± SEM *P < 0.05; **P < 0.005; ***P < 0.0005, ****P < 0.0001; NS, P > 0.05. Scale bars: A–D2 and F–H2, 1,000 μm; J–L2, 200 μm. |
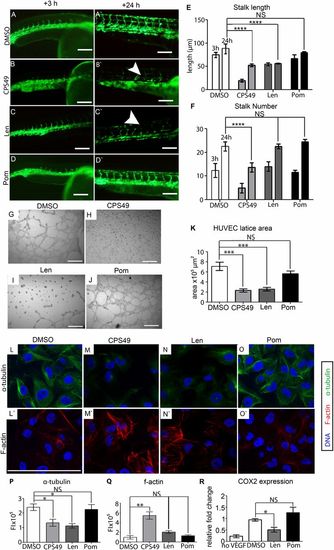
Analysis of antiangiogenic effect of Thalidomide, Lenalidomide, and Pomalidomide at potent, anti-inflammatory concentrations. Effects upon angiogenesis was analyzed, using 24 hpf Fli1:EGFP zebrafish, following incubation for 3 and 24 h with each compound, or DMSO. (A–A2) DMSO control embryos exhibit normal angiogenesis. (B–B2) CPS49 10-μg/mL treatment abolishes blood vessels. (C–C22) Lenalidomide 200 μg/mL (772 μM) treatment consistently showed areas of angiogenic inhibition. (D–D22) Pomalidomide 60 µg/mL (219 μM) treated embryos showed normal angiogenesis and no significant changes in mean stalk length (E) or Mean stalk number (F). To confirm angiogenic sensitivity, HUVEC were plated on ECMatrix and incubated for 18 h. (G–J) Angiogenic growth following compound or DMSO incubation indicates Pomalidomide has no effect as quantified by measuring area of filopodia outgrowth (K). (L–O2) HUVEC were treated with drug or DMSO, then analyzed for α-tubulin (green) and F-actin (red). DNA was visualized with Hoechst dye (blue). HUVEC were treated with 0.1% DMSO, CPS49 10 μg/mL, Lenalidomide 200 μg/mL, or Pomalidomide 60 μg/mL for 4 h, then fixed and stained. (P and Q) Fluorescence intensity (FI) for F-actin and α-tubulin was measured. F-actin was up-regulated following CPS49 treatment and α-tubulin was down-regulated with antiangiogenic drugs. (R) Here, qRT-PCR showed a significant decrease in COX2 expression following Lenalidomide, but not Pomalidomide treatment. (E and F) Statistical significance was analyzed using two-way ANOVA with Bonferroni posttest or (K, P–R) one-way ANOVA with Tukey’s post hoc test; *P < 0.05; **P < 0.005, ***P < 0.0005; ****P < 0.0001; NS, P > 0.05, FI represent fluorescent intensity. (Scale bars: 100 μm.) |
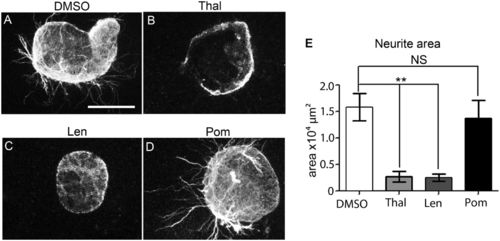
Neurotoxicity of Thalidomide, Lenalidomide, and Pomalidomide at potent, anti-inflammatory concentrations. Ventral temporal pieces of retinas from E14.5 mice embryos were cultured in the presence of DMSO/compound. (A–D) Following anti–β-tubulin staining and fluorescence imaging, the area of neurite outgrowth was analyzed following DMSO, Thalidomide 250 μg/mL (968 μM), Lenalidomide 200 μg/mL (772 μM), or Pomalidomide 60 μg/mL (219 μM) treatment. (E) Quantification of neurite outgrowth, indicating Pomalidomide has no effect on neurite outgrowth. Statistical significance was analyzed one-way ANOVA with Tukey’s post hoc test. Graphs represent mean ± SEM *P < 0.05; **P < 0.005; ***P < 0.0005; ****P < 0.0001; NS, P > 0.05. (Scale bar: 300 μm.) |