
|
Fig. 2
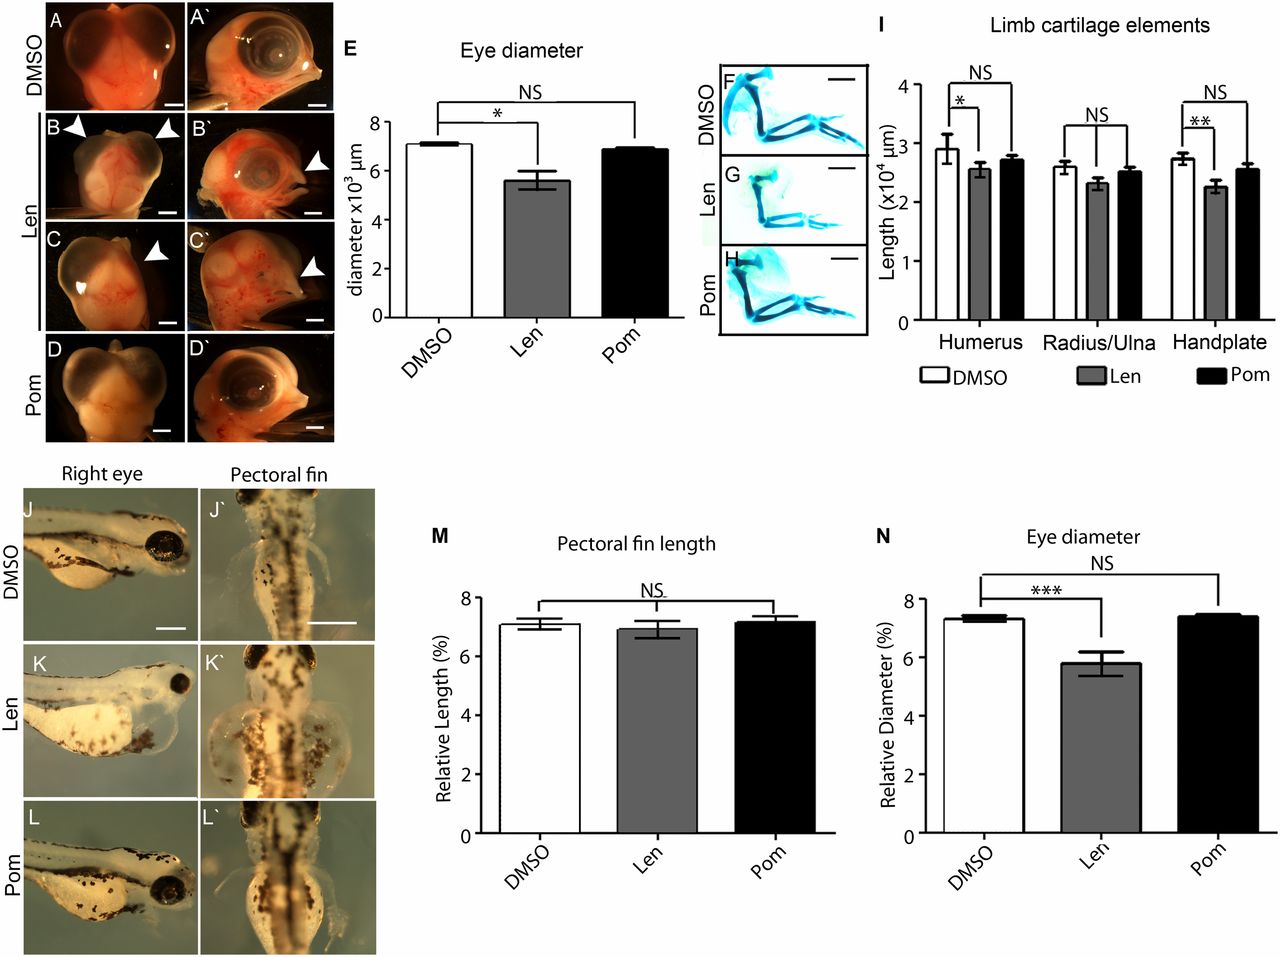
Teratogenic action of Lenalidomide and Pomalidomide at potent, anti-inflammatory concentrations. Chicken embryos were treated at HH St17-19, incubated and then fixed at E9. Head, eye, and limb growth was analyzed. (A–A2) Control head region following DMSO treatment. (B–C2) Lenalidomide 200 µg/mL (772 μM) treatment results in severe head defects, particularly beak (B–C2) and eye defects (C2). (D–D2) Pomalidomide 60 μg/mL (219 μM) does not affect head development. (E) Eye diameter is unchanged following DMSO, and Pomalidomide treatment, but is decreased following Lenalidomide treatment. (F–H) Cartilage stains 6 d after drug application. (I) Limb element length quantification. Pomalidomide treated limbs are unaffected. Zebrafish embryos were incubated with compound/DMSO at 24 hpf, and then imaged at 96 hpf. Fins, eyes, and otic vesicles were measured. (J–J2) DMSO control embryos. (K–K2) Lenalidomide-treated embryos. (L–L2) Pomalidomide-treated embryos. (M–N) Quantification of cartilage structures. Statistical significance was analyzed using one-way ANOVA with Tukey’s post hoc test. (J–L2). Graphs represent mean ± SEM *P < 0.05; **P < 0.005; ***P < 0.0005, ****P < 0.0001; NS, P > 0.05. Scale bars: A–D2 and F–H2, 1,000 μm; J–L2, 200 μm.