
|
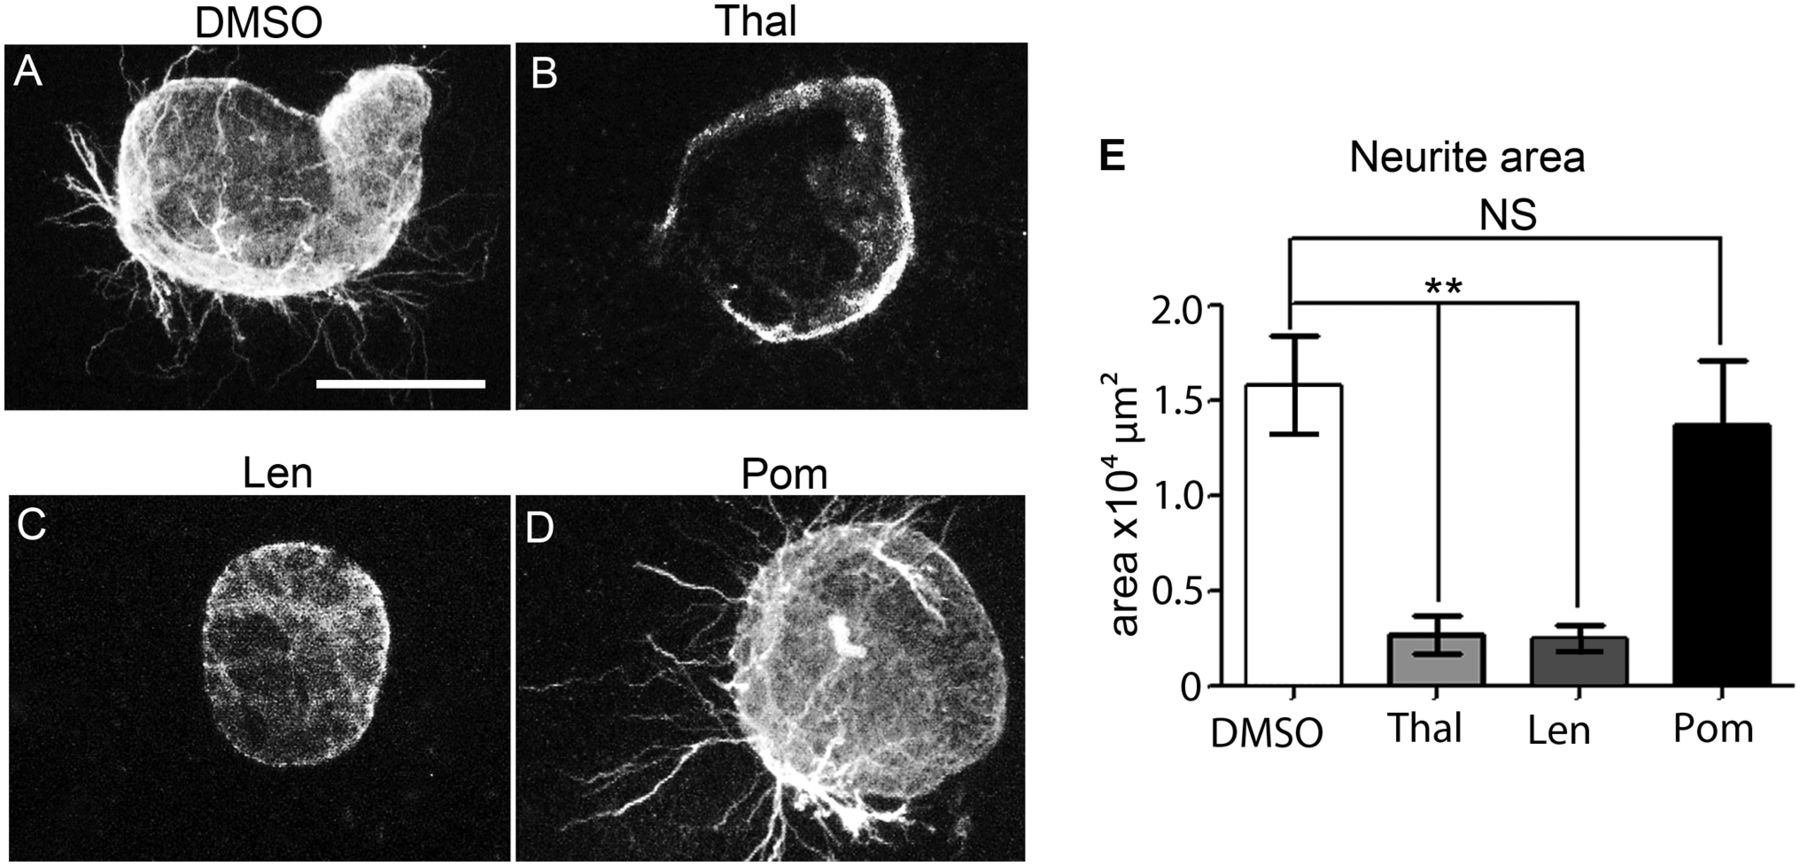
Fig. 4
Neurotoxicity of Thalidomide, Lenalidomide, and Pomalidomide at potent, anti-inflammatory concentrations. Ventral temporal pieces of retinas from E14.5 mice embryos were cultured in the presence of DMSO/compound. (A–D) Following anti–β-tubulin staining and fluorescence imaging, the area of neurite outgrowth was analyzed following DMSO, Thalidomide 250 μg/mL (968 μM), Lenalidomide 200 μg/mL (772 μM), or Pomalidomide 60 μg/mL (219 μM) treatment. (E) Quantification of neurite outgrowth, indicating Pomalidomide has no effect on neurite outgrowth. Statistical significance was analyzed one-way ANOVA with Tukey’s post hoc test. Graphs represent mean ± SEM *P < 0.05; **P < 0.005; ***P < 0.0005; ****P < 0.0001; NS, P > 0.05. (Scale bar: 300 μm.)