
- Title
-
Expression of chondroitin/dermatan sulfate glycosyltransferases during early zebrafish development
- Authors
- Filipek-Górniok, B., Holmborn, K., Haitina, T., Habicher, J., Oliveira, M.B., Hellgren, C., Eriksson, I., Kjellén, L., Kreuger, J., and Ledin, J.
- Source
- Full text @ Dev. Dyn.
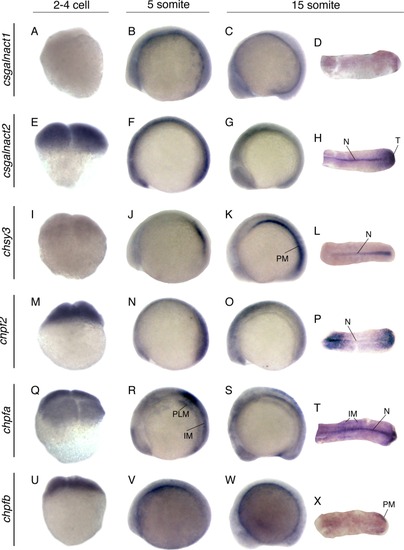
Whole mount in situ hybridization of CS/DS glycosyltransferases during the early stages of zebrafish development. All images show lateral views, except for the images in the rightmost column that show dorsal views of the posterior tail part of embryos. Early embryonic expression is demonstrated for csgalnact1 (A–D), csgalnact2 (E–H), chsy3 (I–L), chpf2 (M–P), chpfa (Q–T), and chpfb (U–X). N, notochord; PLM, posterior lateral mesoderm; IM, intermediate mesoderm; PM, paraxial mesoderm; TB, tail bud; S, somites. EXPRESSION / LABELING:
|

Whole mount in situ hybridization of CS/DS glycosyltransferases at 24–48 hpf during zebrafish development. All images represent lateral views showing the mRNA levels of csgalnact1 (A–C), csgalnact2 (D–F), chsy3 (G–I), chpf2 (J–L), chpfa (M–O), and chpfb (P–R). Arrows indicate the position for sections shown in Figure 6. FB, forebrain; HB, hindbrain; ICM, intermediate cell mass; MB, midbrain; MFF, median fin fold; MHB, midbrain-hindbrain boundary; NC, neural crest; OC, otic capsule; P, proctodeum; PD, pronephric duct; PF, pectoral fin; PC, pharyngeal cartilage; R, retina; S, somites; TC, trabecula cranii. |
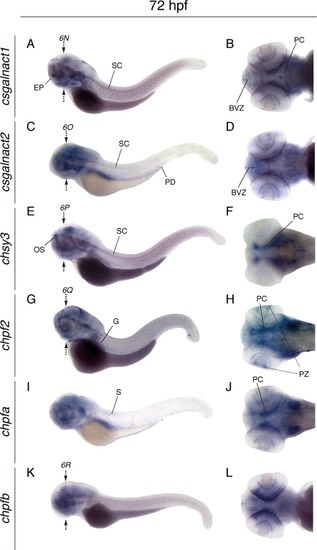
Whole mount in situ hybridization of CS/DS glycosyltransferases at 72 hpf. Lateral views of larvae (left) and dorsal views of larval heads (right), showing the expression patterns of csgalnact1 (A,B), csgalnact2 (C,D), chsy3 (E,F), chpf2 (G,H), chpfa (I,J), and chpfb (K,L). Arrows indicate the position for sections shown in Figure 6. BVZ, brain ventrical zone; PC, pharyngeal cartilage; EP, ethmoid plate; G, gut; OS, olfactory system; PD, pronephric duct; PZ, proliferating zone of retina; SC, spinal cord. EXPRESSION / LABELING:
|

Sections of embryos subjected to in situ hybridization of CS/DS glycosyltransferases. Transversal sections showing the expression patterns of csgalnact1 at 48 hpf (A,B) and 72 hpf (N,O), csgalnact2 at 48 hpf (C,D) and 72 hpf (P,Q), chsy3 at 24 hpf (E), 48 hpf (F,G) and 72 hpf (R,S), chpf2 at 48 hpf (H,I) and 72 hpf (T), chpfa at 36 hpf (J) and 48 hpf (K,L), and chpfb at 48 hpf (M) and 72 hpf (U). The position of each section is indicated with an arrow marked in Figure 4 and figure 5. Magnifications of boxed areas are shown to the right (A–D, F–H, K, N, P, Q). Arrowheads mark pharyngeal cartilage. B, brain; N, notochord; NC, neural crest; PF, pectoral fin. EXPRESSION / LABELING:
|
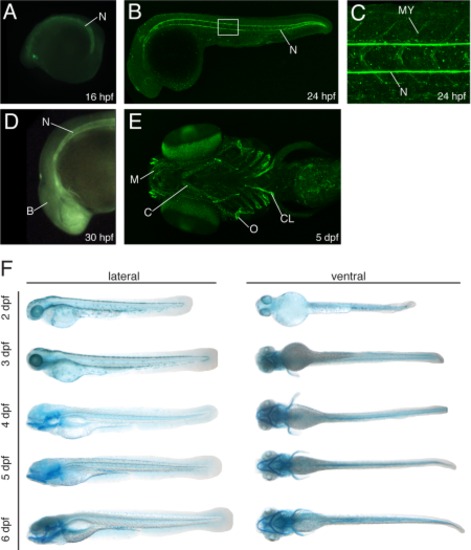
The notochord and cartilage structures are sites of CS/DS accumulation. A–D: Lateral views of zebrafish embryos and larvae showing CS deposition as detected with the CS-56 antibody. The notochord is weakly stained at 16 hpf (A) and more prominent CS deposition is seen at 24 hpf and 30 hpf (B–D). CS deposition in the myoseptum is shown in C, which is a magnification of the boxed area in B. Brain tissues are weakly stained at 30 hpf (D). E: CS is present in the pharyngeal cartilages (the Meckel′s cartilage and the ceratohyal) and in dermal bones (the operculum and the cleithrum) at 5 dpf. F: Ventral and lateral views of a zebrafish embryo stained with Alcian blue to detect CS/DS at 2–6 dpf. B, brain; C, ceratohyal; CL, cleithrum; M Meckel′s cartilage; MY, myoseptum; N, notochord; O, operculum. EXPRESSION / LABELING:
|