- Title
-
A single enhancer regulating the differential expression of duplicated red-sensitive opsin genes in zebrafish
- Authors
- Tsujimura, T., Hosoya, T., and Kawamura, S.
- Source
- Full text @ PLoS Genet.
|
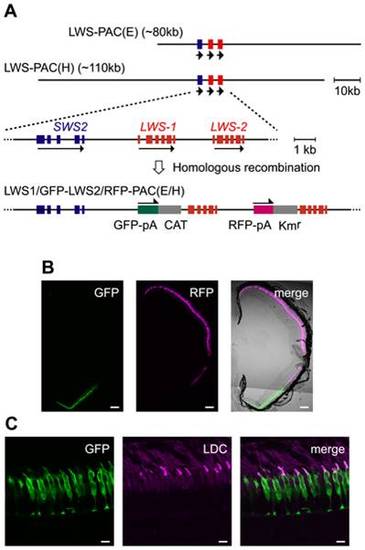
Recapitulation of the LWS-1 and LWS-2 expression in the zebrafish retina by the fluorescent markers in the PAC clones. (A) Construction of the LWS1/GFP-LWS2/RFP-PAC clones. The two PAC clones, LWS-PAC(E) and LWS-PAC(H), both encompass the two red opsin genes, LWS-1 and LWS-2, in addition to the blue opsin gene, SWS2. In the expanded view, the blue and red boxes indicate the exons of the blue and red opsin genes, respectively. The orientation of transcription is given by the arrows for each gene. In both the LWS1/GFP-LWS2/RFP-PAC(E) and LWS1/GFP-LWS2/RFP-PAC(H) clones, the first exons of LWS-1 and LWS-2 were replaced with the GFP-polyA-CAT and RFP-polyA-Kmr cassettes by site-specific homologous recombination, respectively. (B) A transverse section of the retina of an adult Tg(LWS1/GFP-LWS2/RFP-PAC(E))#1229 fish. The dorsal side is oriented at the top of each panel and the ventral side is at the bottom. GFP (green) is expressed in the ventral region (left), whereas RFP (magenta) is expressed in the central to dorsal region (middle). The right panel shows the merge of the left two panels with the transmitted light image taken by the differential interference contrast microscopy (DIC image). (C) A vertical section of the photoreceptor layer in the ventral retina of an adult Tg(LWS1/GFP-LWS2/RFP-PAC(H))#430 fish. The outer segments of LDCs are immunostained with an antibody against the zebrafish red opsin (magenta). Note that the GFP (green) is found mostly in the cell body of LDCs. Scale bars = 100 μm for (B), 10 μm for (C). EXPRESSION / LABELING:
|
|
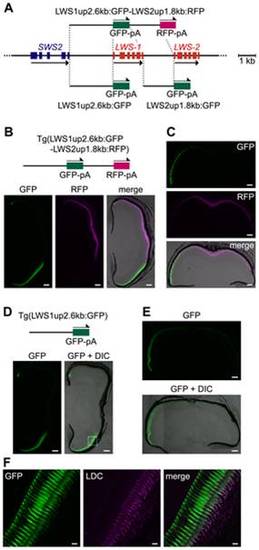
Regulatory ability of the 52 flanking regions of LWS-1 and LWS-2. (A) Schematic representation of the GFP or RFP expression constructs. (B) A transverse section of an adult Tg(LWS1up2.6kb:GFP-LWS2up1.8kb:RFP)#1631 retina. The dorsal side is oriented at the top of each panel and the ventral side is at the bottom. The left and middle panels show the GFP (green) and RFP (magenta) images, respectively. The right is the merge of the two panels with the DIC image. (C) A horizontal section of the retina from the same adult individual shown in (B). The nasal side is shown on the left and the temporal side is on the right. The upper and middle panels show the GFP (green) and RFP (magenta) images, respectively, and the lower one is the merge of the two panels with the DIC image. (D, E) Transverse (D) and horizontal (E) sections of an adult Tg(LWS1up2.6kb:GFP)#1509 retina. The left (D) and top (E) panels show images of GFP signals (green) and the right (D) and bottom (E) panels show their overlays with the DIC images. The dorsal side is oriented at the top of each panel and the ventral side is at the bottom in (D). The nasal side is oriented on the left and the temporal side is on the right in (E). (F) A vertical view of the photoreceptor layer magnified from the dashed rectangle in (D). The left panel shows the GFP signals (green) and the middle panel shows the signals of immunostaining against the zebrafish red opsin in the outer segments of LDCs (magenta). The right panel shows a merge of the left two panels. The overlap of the two signals appears as white. Scale bars = 100 μm for (B–E), 10 μm for (F). EXPRESSION / LABELING:
|
|
LDC–specific expression of GFP in the entire retina by LAR:LWS2up1.8kb:GFP. (A) Schematic representation of the construction of LAR:LWS2up1.8kb:GFP. (B, C) Transverse (B) and horizontal (C) sections of an adult Tg(LAR:LWS2up1.8kb:GFP)#1499 retina. The left (B) and top (C) panels show images of GFP signals (green) and the right (B) and bottom (C) panels show their overlays with the DIC images. The dorsal side is oriented at the top of each panel and the ventral side is at the bottom in (B). The nasal side is on the left and the temporal side is on the right in (C). (D) A vertical and expanded view of the photoreceptor layer from the same eye sample as shown in (B). The left panel shows the GFP signals (green) and the middle panel shows the signals of immunostaining against the zebrafish red opsin in the outer segments of LDCs (magenta). The right panel shows a merge of the left two panels. The overlap of the two signals appears as white. Scale bars = 100 μm for (B, C), 10 μm for (D). EXPRESSION / LABELING:
|
|
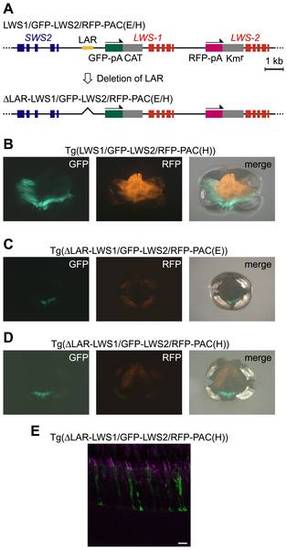
A negative effect of LAR deletion in the reporter gene expression from the LWS1/GFP-LWS2/RFP-PAC clones. (A) Schematic representation of the construction of ”LAR-LWS1/GFP-LWS2/RFP-PAC(E) and (H). (B, C, D) Images of a whole mount retina of an adult Tg(LWS1/GFP-LWS2/RFP-PAC(H))#430 (B), Tg(”LAR-LWS1/GFP-LWS2/RFP-PAC(E))#1143 (C), and Tg(”LAR-LWS1/GFP-LWS2/RFP-PAC(H))#1107 (D) fish. The dorsal side is oriented at the top of each panel, and the nasal side is on the left. The GFP signals appear as green and the RFP signals appear as orange. The right panel is the overlay of the left and center panels. (E) A vertical and expanded view of the photoreceptor layer from the same transgenic line as shown in (D). The LDCs were immunostained with the antibody against the zebrafish red opsin (magenta). The GFP signals appear as green. Overlap of the two signals appears as white. Scale bars = 10 μm. EXPRESSION / LABELING:
|
|
A transverse section of a Tg(LWS1up2.6kb:GFP-LWS2up1.8kb:RFP)#1464 retina. The dorsal side is oriented at the top of each panel and the ventral side is at the bottom. The left and middle panels show the GFP (green) and RFP (magenta) images, respectively. The right is the merge of the two panels with the DIC image. The sparse expression of RFP in the central to dorsal area is indicated by arrows. Scale bars = 100 μm. EXPRESSION / LABELING:
|
|
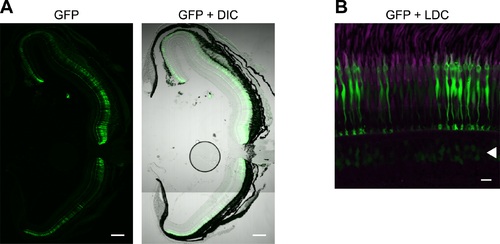
Expression of GFP in a Tg(LAR:LWS2up1.8kb:GFP)#1501 retina. (A) A transverse section of a Tg(LAR:LWS2up1.8kb:GFP)#1501 retina. The left panel shows the image of GFP signals (green) and the right panel shows the overlay with its DIC image. The dorsal side is oriented at the top of each panel and the ventral side is at the bottom. (B) A vertical and expanded view of the photoreceptor layer of the same retina as shown in (A). GFP (green) was specifically expressed in LDCs, whose outer segments were immunostained with the antibody against the zebrafish red opsin (magenta). Arrowheads indicate the faint GFP signals detected in some bipolar cells. Scale bars = 100 μm (A), 10 μm (B). EXPRESSION / LABELING:
|


